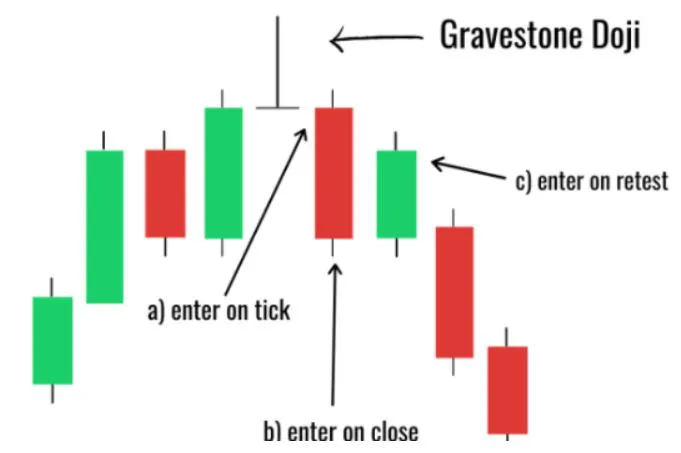
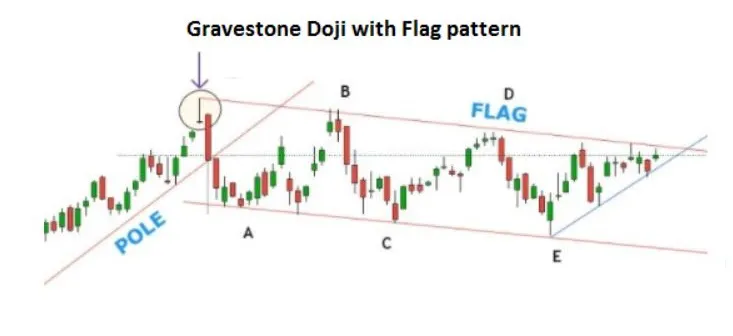
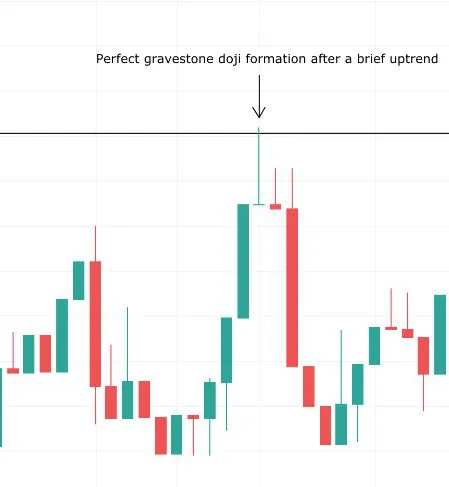
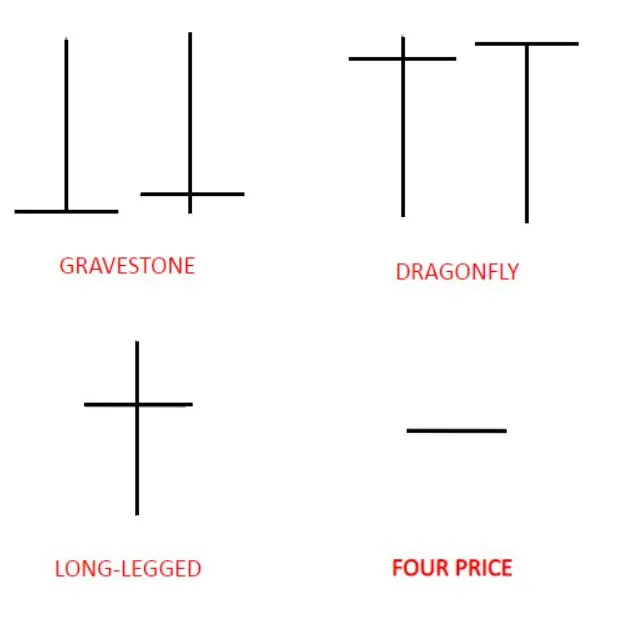
- Gravestone
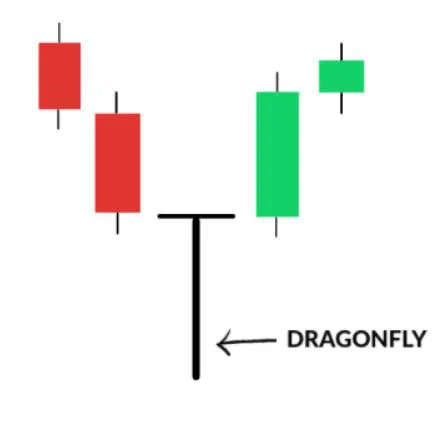
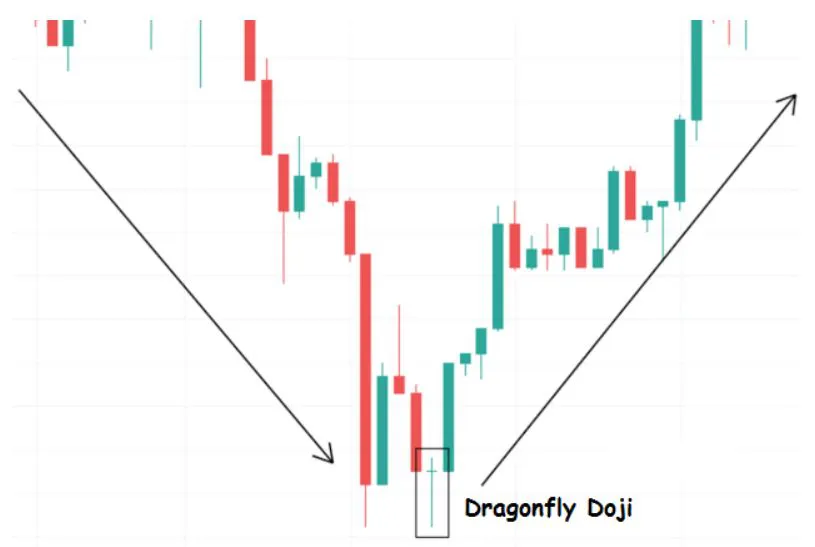
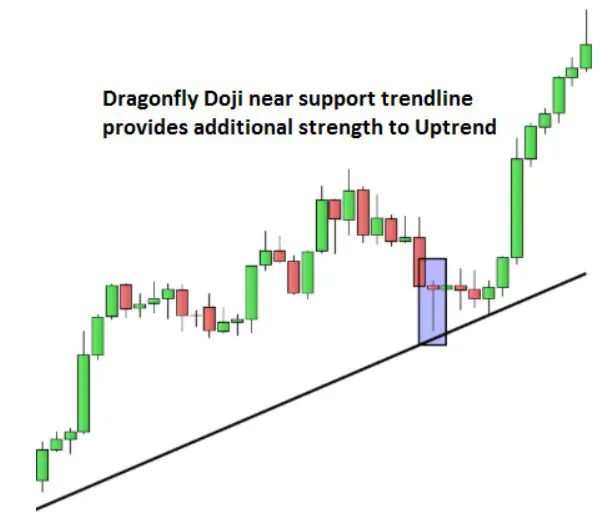
- Dragonfly
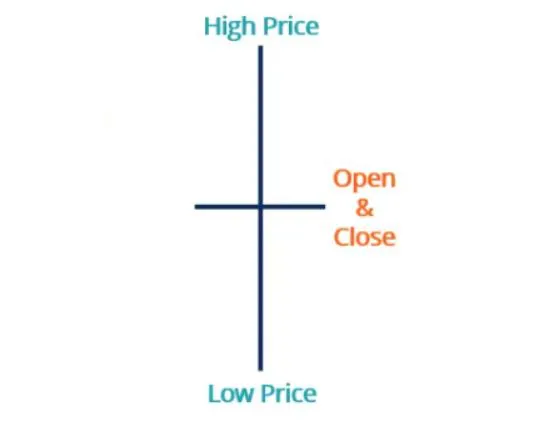
- Long-Legged
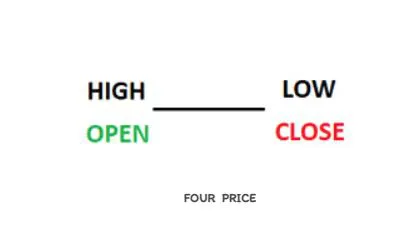
- Four Price
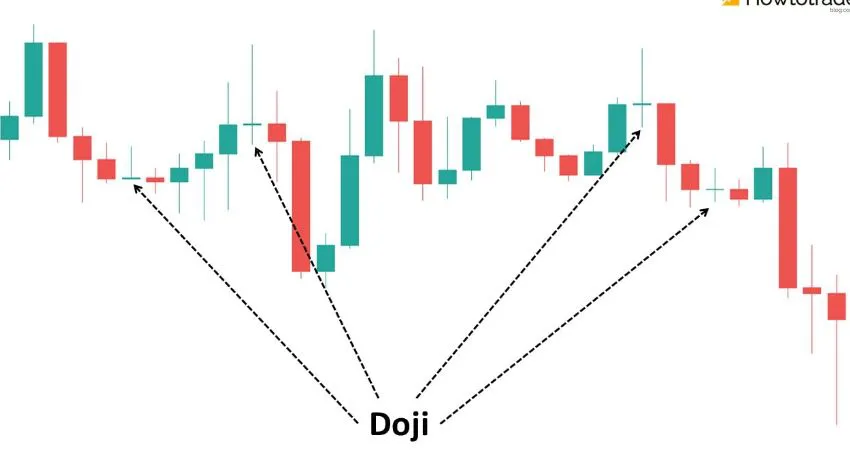
Doji
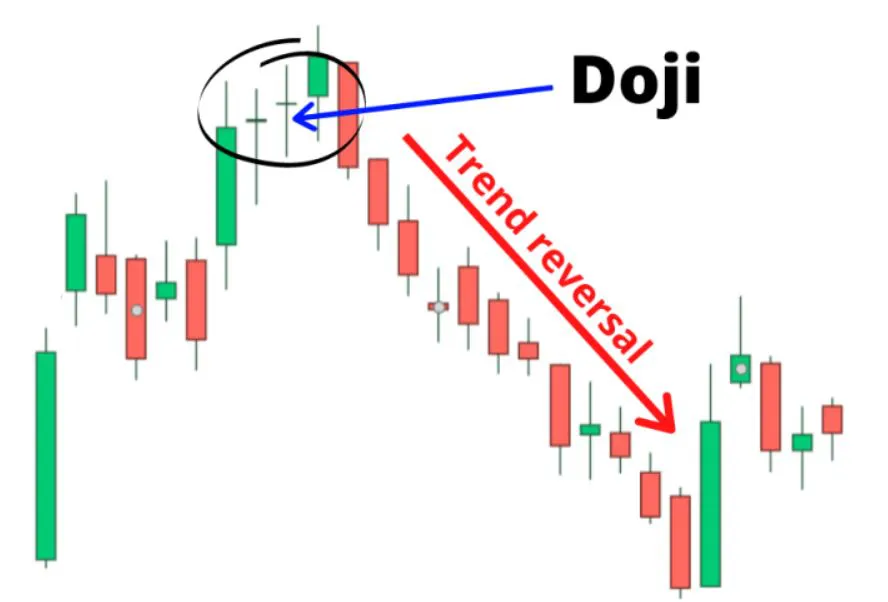
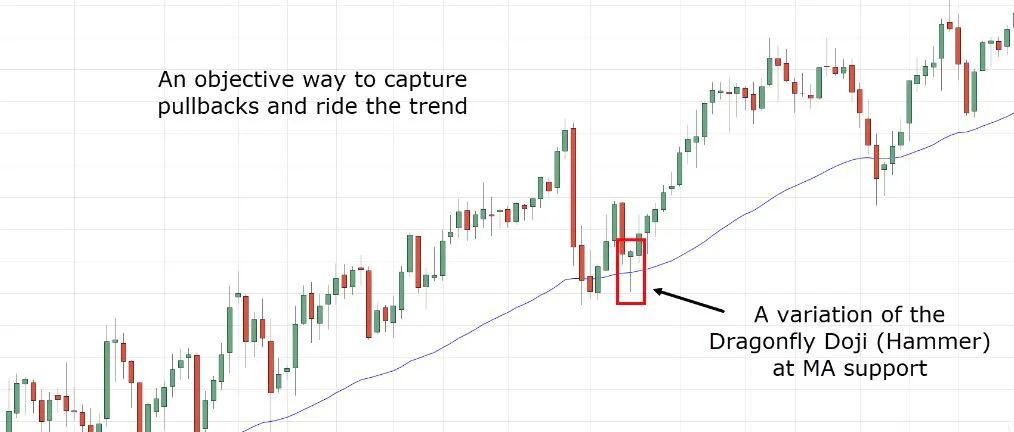
A Doji is a candlestick pattern that is formed when the opening and closing prices of a stock or asset are nearly the same, resulting in a small or non-existent real body with a wick. These patters will be considered as strongest and Reversal patterns.
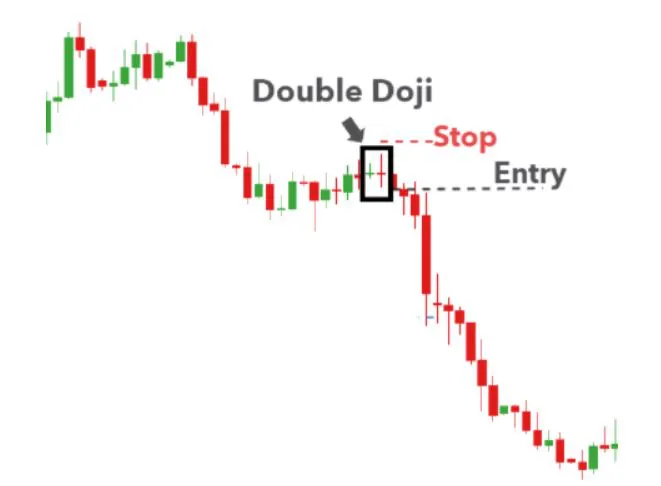
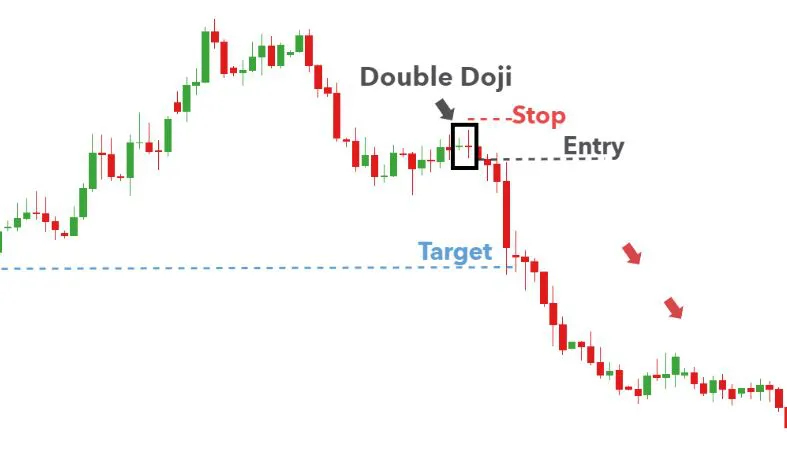
Traders interpret the Doji pattern as a sign of potential trend reversal or continuation, depending on where it appears in the trend. For example, if the Doji appears at the end of an uptrend, it may indicate a potential bearish reversal, while if it appears in the middle of a trend, it may signal a continuation of the current trend.
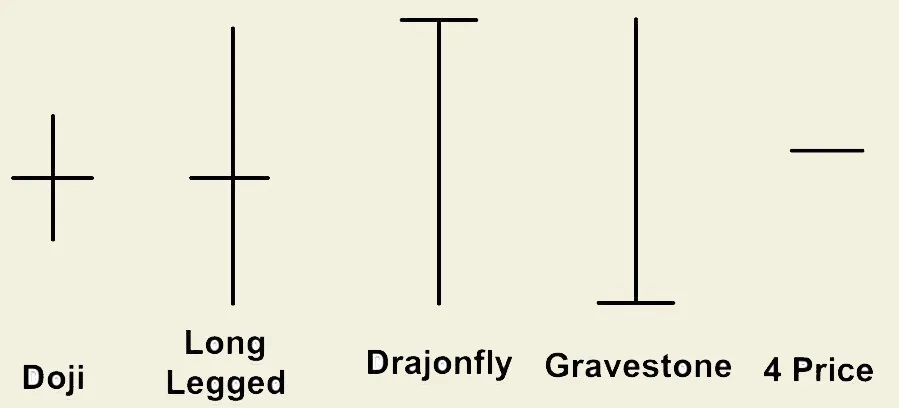
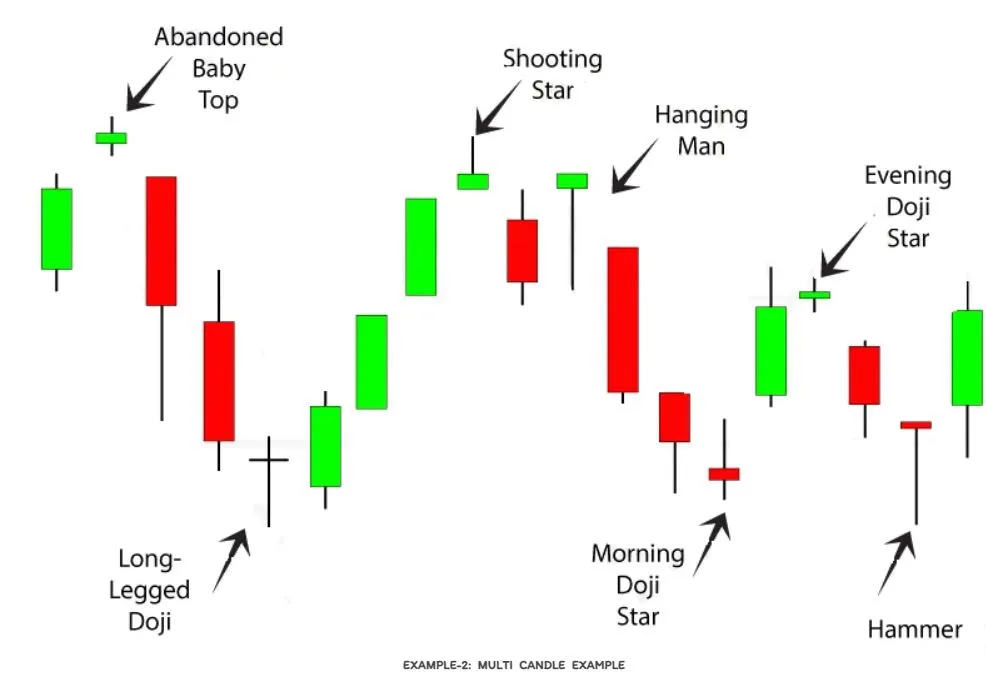
Below are few variations of Doji pattern based on shadow size: