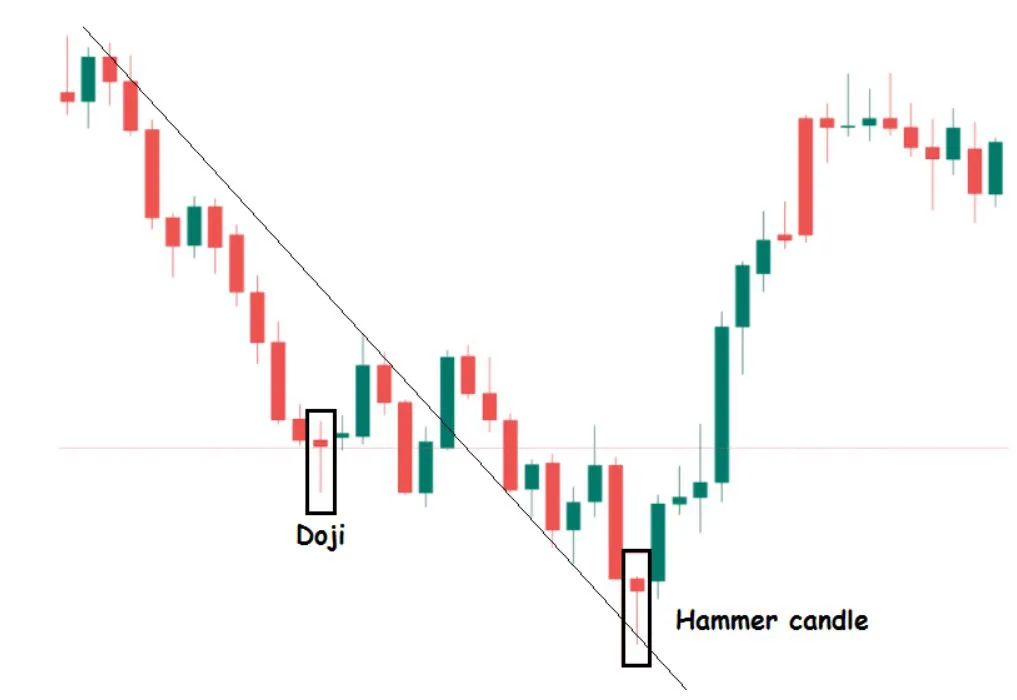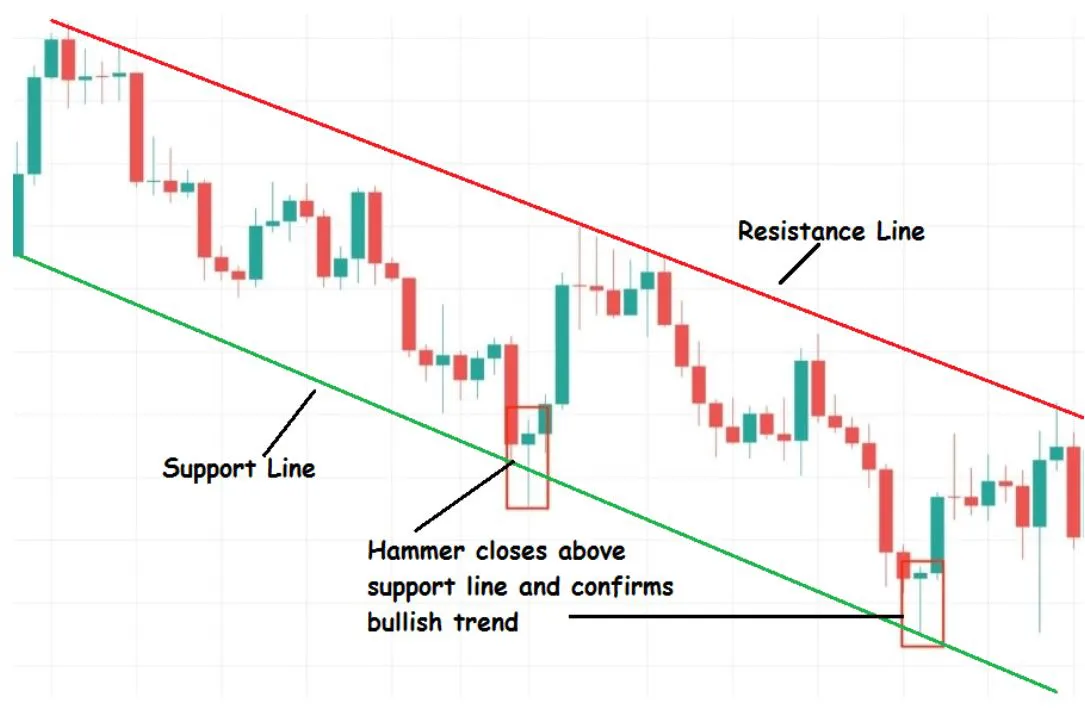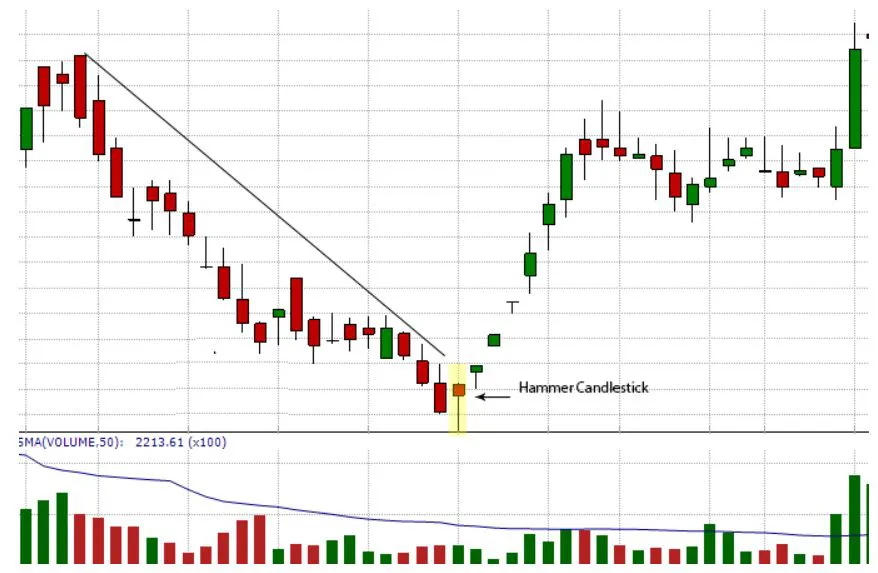
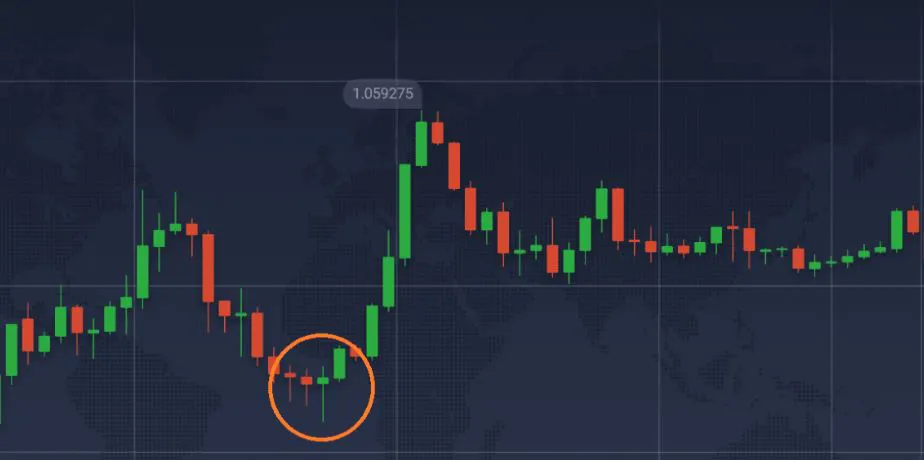
- The hammer pattern can indicate a potential trend reversal in the market, particularly when it appears at the bottom of a downtrend.
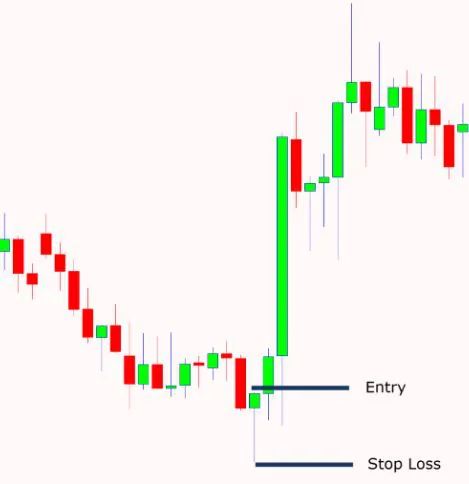
- The bottom or close of a hammer candle can be considered a support level.
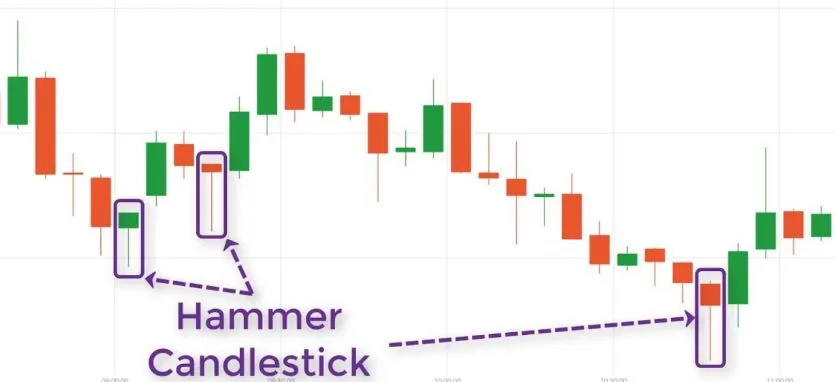
- Simple pattern to identify on a candlestick chart.
- The color of the body of a hammer candle is not important.
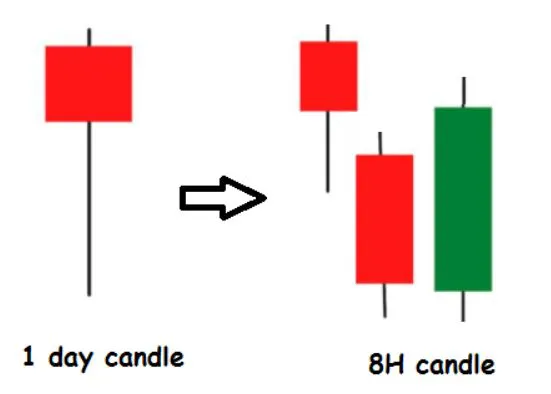
- The shadows (or wicks) of hammer candles should ideally be 2-3 times the size of the body.
- Hammers don't provide a specific target, but they do suggest that traders may be interested in going against the trend and that a trend reversal might occur.
Hammer
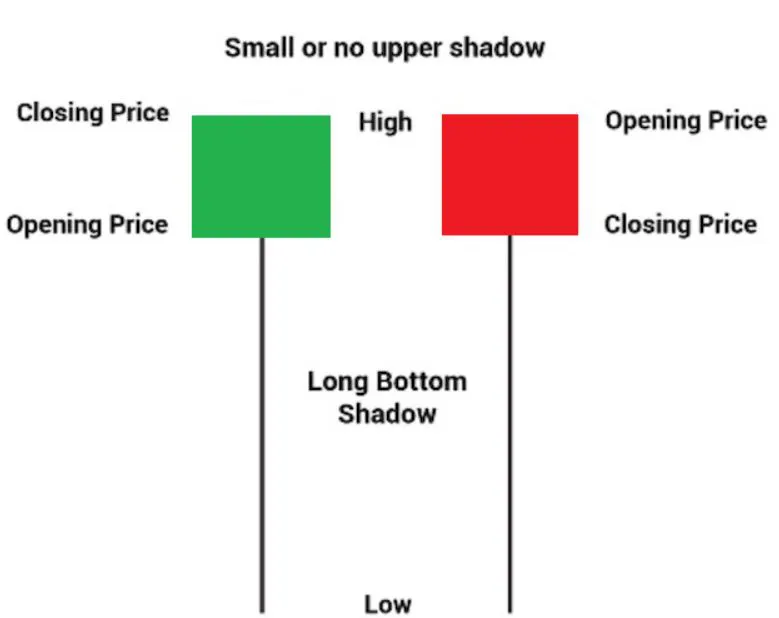
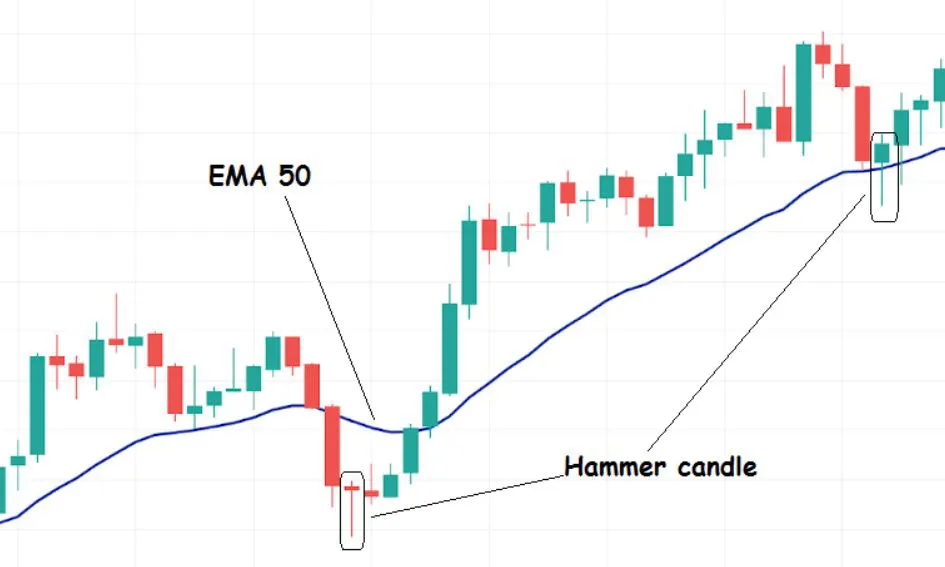
A hammer candlestick pattern is formed when a candlestick has a small body near the top of its range, with a long lower shadow (or "wick") that extends well below the body.
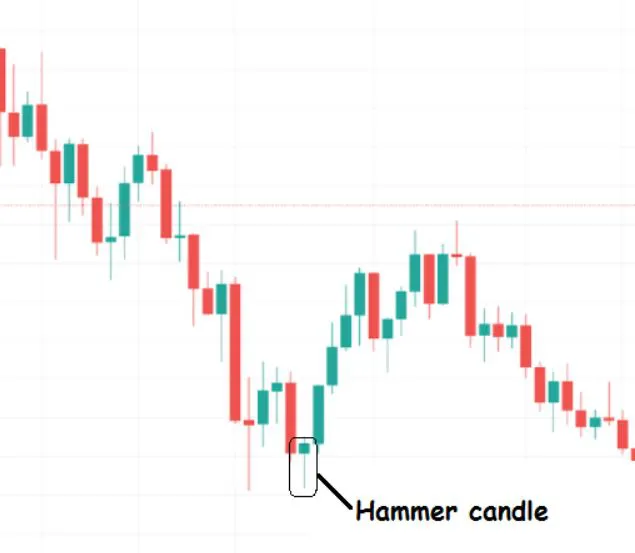
The hammer pattern suggests that the price initially fell significantly during the trading session, but then buyers stepped in and pushed the price back up, creating a long lower shadow. The hammer pattern suggests that sellers are losing their grip on the market, and that buyers may be taking over.