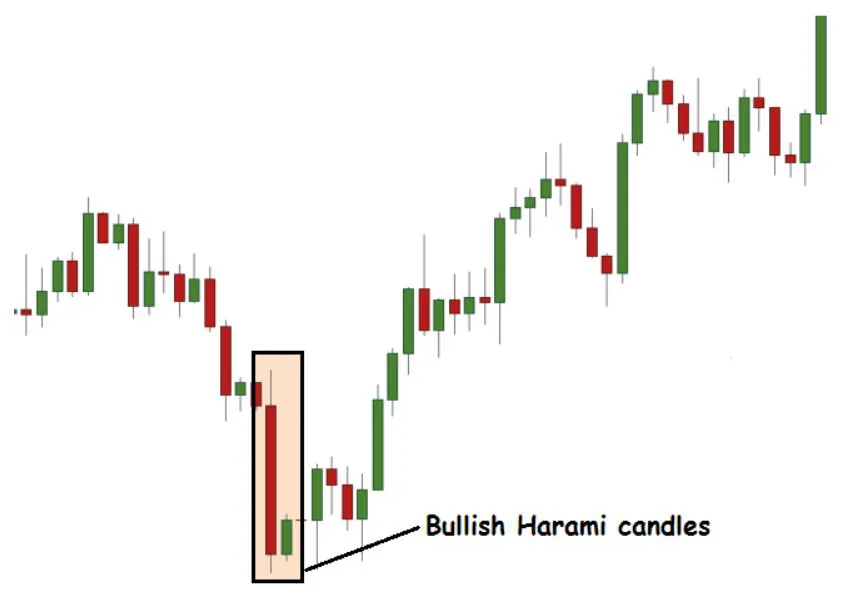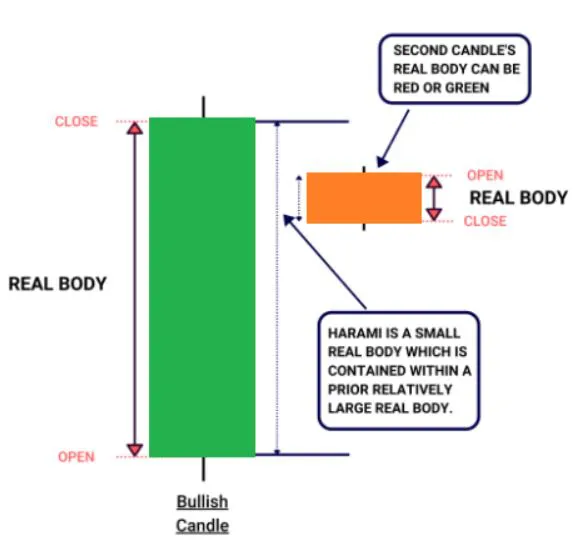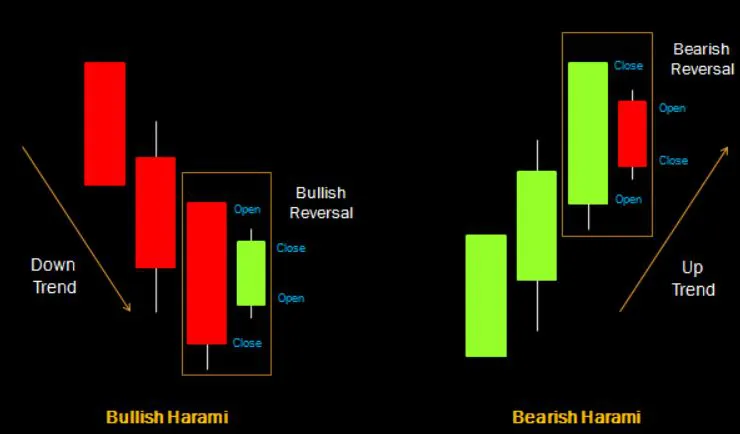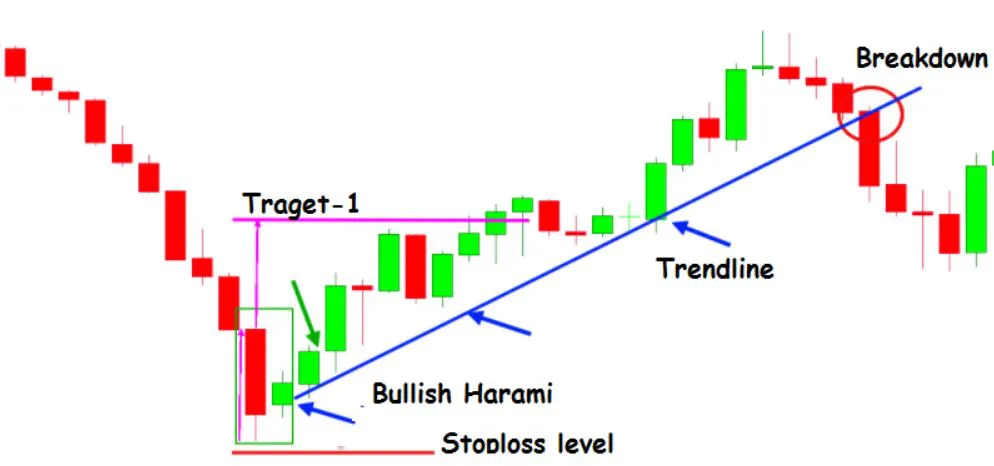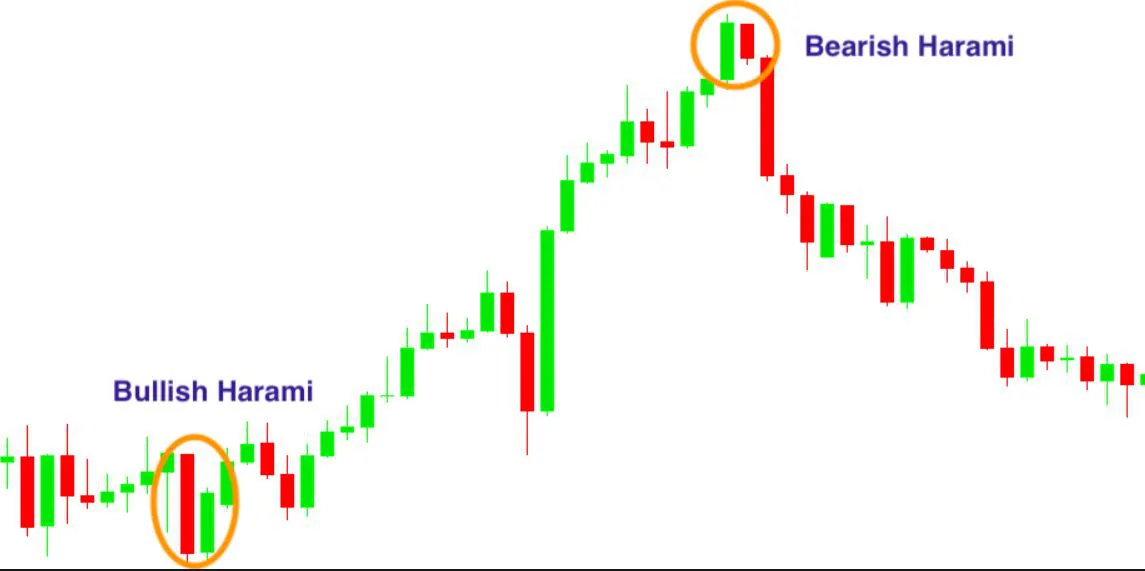
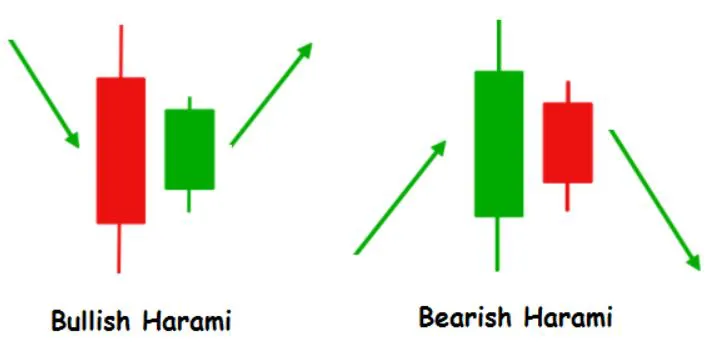
- Bullish Harami pattern
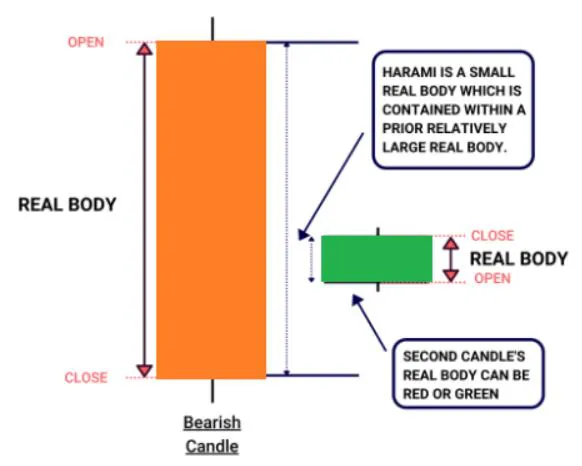
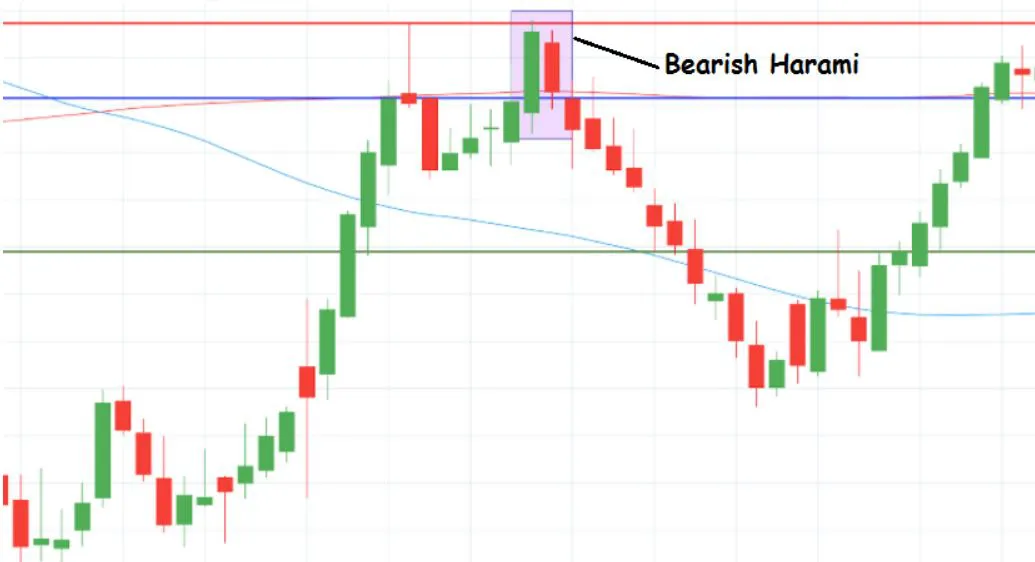
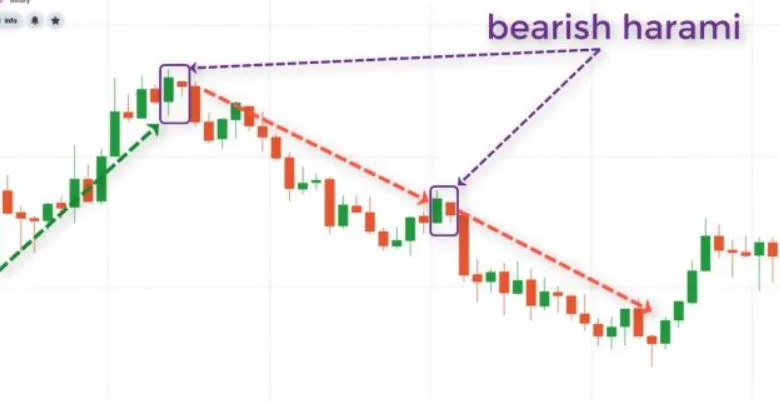
- Bearish Harami pattern
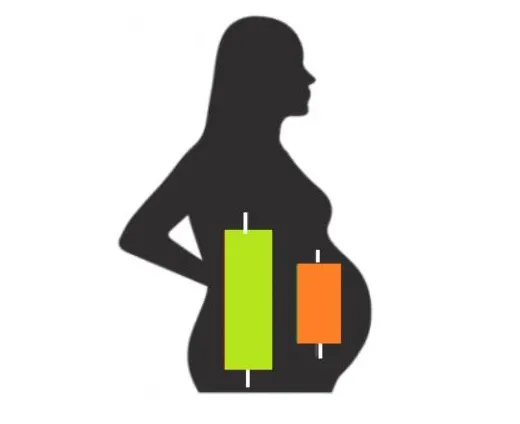
HARAMI
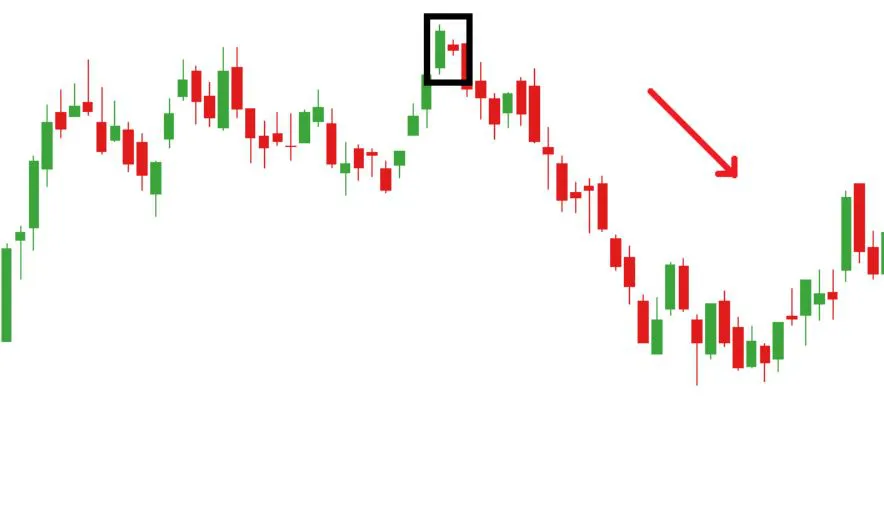
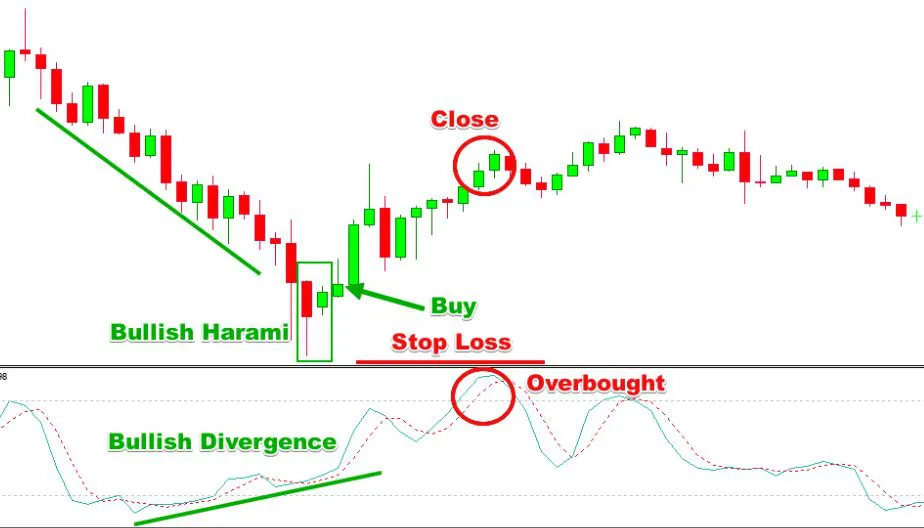
Harami is a Japanese candlestick pattern that indicates a potential trend reversal. The pattern consists of two candlesticks, where the first candlestick is larger and has a long body, and the second candlestick is smaller and has a short body, which is completely engulfed within the body of the first candlestick.
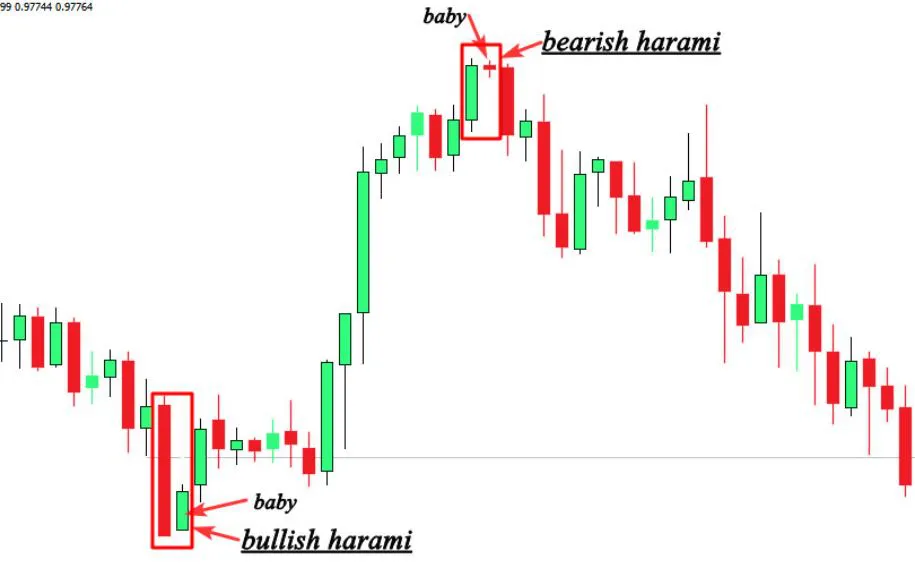
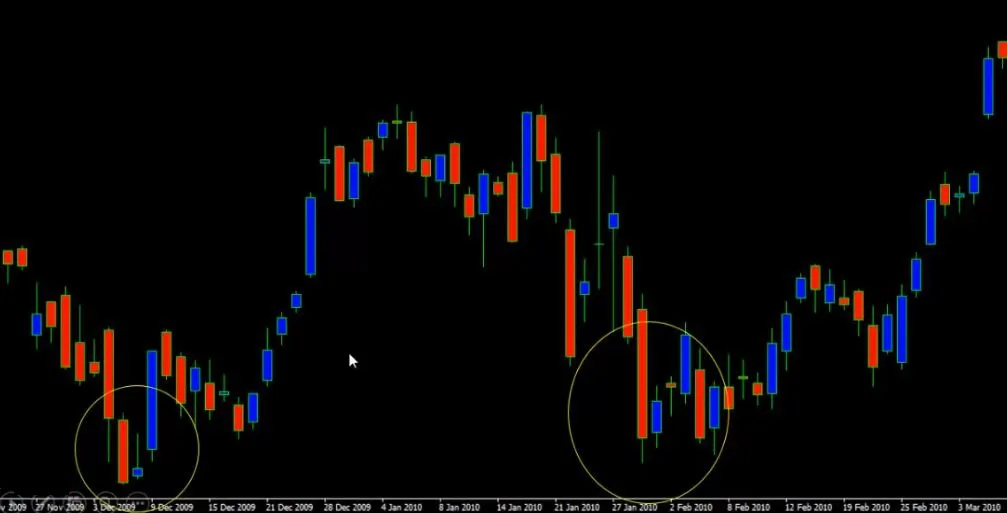
The second candle will have a Gaps at higher or lower. This gap makes different while compare to other candlesticks.
In stock markets, it's common to see candlesticks opening with a gap up or down, where the opening price is significantly different from the previous day's closing price.