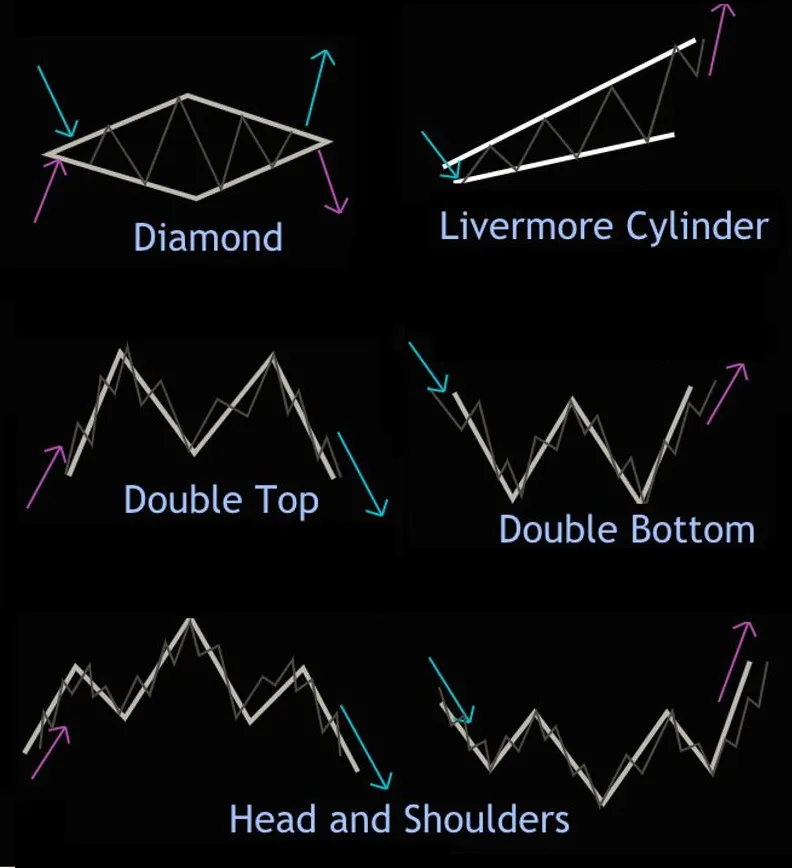
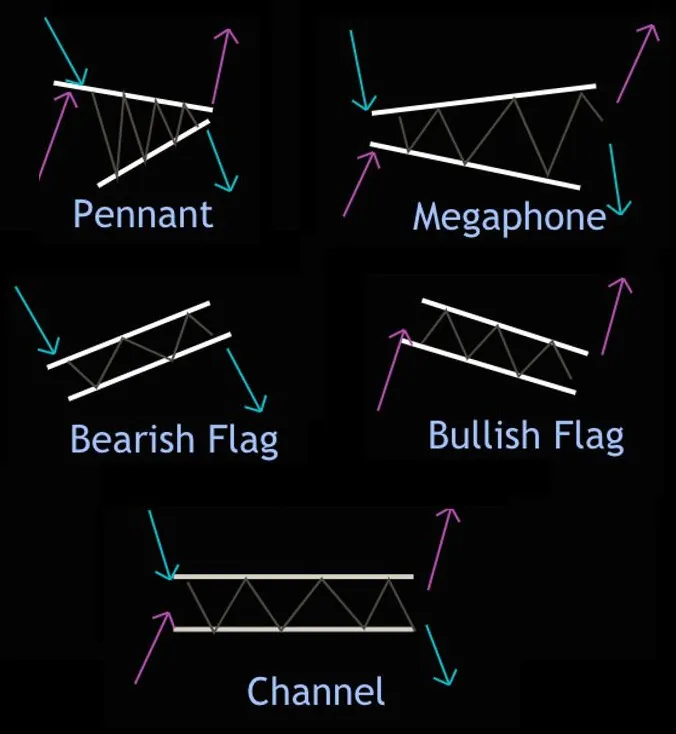
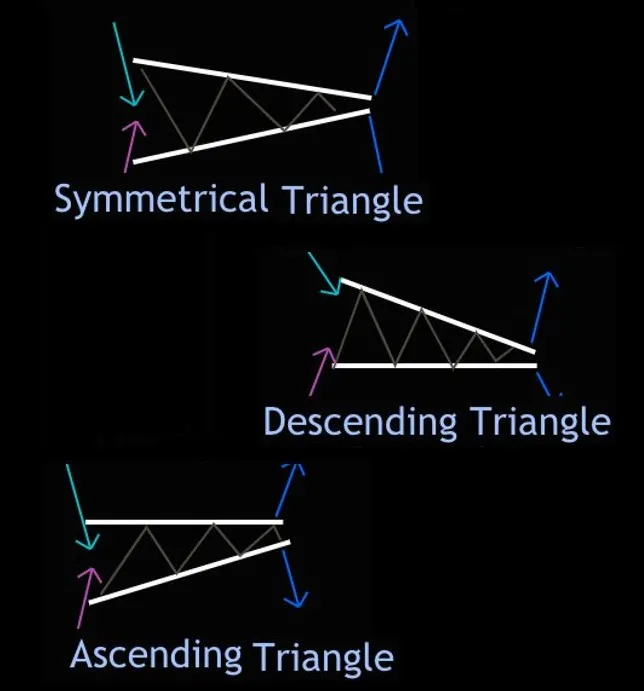
- Reversal Patterns
- Continuation Patterns
- Neutral Patterns
Trend Patterns
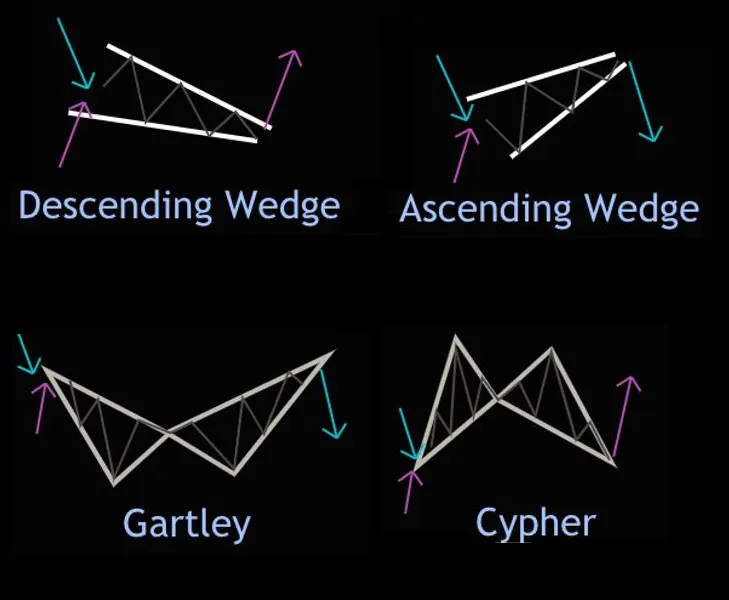
Patterns in trading refer to specific formations or movements that can be identified on price charts by analyzing historical price and volume data. Traders use patterns to predict future price movements and make trading decisions.
Reversal patterns indicate that price will reverse its current direction meaning that price will be going in one direction and when the pattern appears it will start going in the opposite direction immediately.
Reversal patterns can be bullish or bearish. The terms bullish and bearish are part of the market to indicate if something is going up or down.
just as a curiosity when traders say bullish they want to indicate upside because Bulls throw their price up when they attack, and traders say bearish they want to indicate downside because bears throw their price down when they attack.
Just remember, bullish reversal pattern signals that price will go up, and in a bearish reversal pattern signals that price will go down.
Continuation patterns indicate that price will continue to go in its current direction. Like the name suggests, the continuation pattern states that price will continue its current trajectory instead of reversing it. Like reversal patterns continuation patterns can be bullish or bearish in a bullish.
In a bullish continuation pattern price will be going up and then a specific pattern will appear to signal that price will continue to go up instead of reversing to the downside. the term bullish indicates the direction price will go immediately after the pattern.
In a bearish continuation pattern price will be going down and then a specific pattern will appear to signal that price will continue to go down instead of reversing to the upside. once again the term bearish indicates the direction price will go immediately after the pattern
Neutral pattern patterns indicate a momentary stop in price. Unlike reversal and continuation types, there is no such thing as bullish or bearish neutral patterns. In a neutral pattern price can either be going up or down and then a specific candlestick pattern will appear to signal that price stop the advancing in its current direction.
For example imagine that price was going up, if a neutral pattern appears it will indicate that price has momentarily stopped going up, but it doesn't necessarily mean it will continue going up or reverse to the downside.
In other words the neutral pattern doesn't indicate the direction that price will go next just indicates that price has momentarily stopped advancing its current direction.
While patterns can be useful tools for traders, it's important to keep in mind that they are not always reliable predictors of future market movements.
As such, traders should consider other factors, such as news events, trend and market sentiment etc. when making trading decisions.