DOUBLE TOP

The Double Top pattern is a bearish reversal pattern that looks like the letter "M" on a price chart. The pattern forms after a strong bullish trend, with the first top forming at the end of the trend.

This is exactly opposite to Double bottom pattern

  1. Double Top

    The Double Top pattern is formed when the price fails to break through a resistance level (the first high), and the market experiences a shift in momentum. This may indicate that buyers are no longer willing to pay higher prices, and that selling pressure is starting to increase.

    How Double Bottom formed?

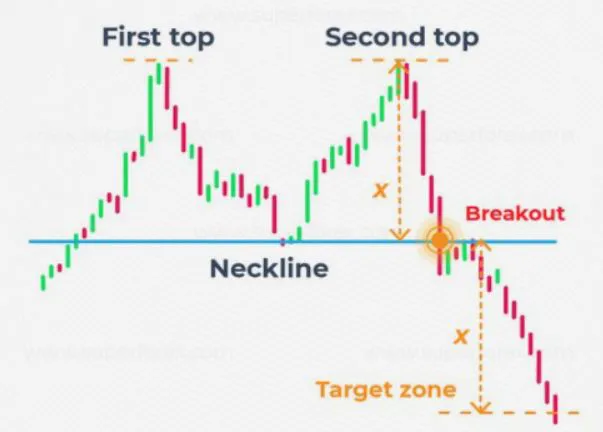
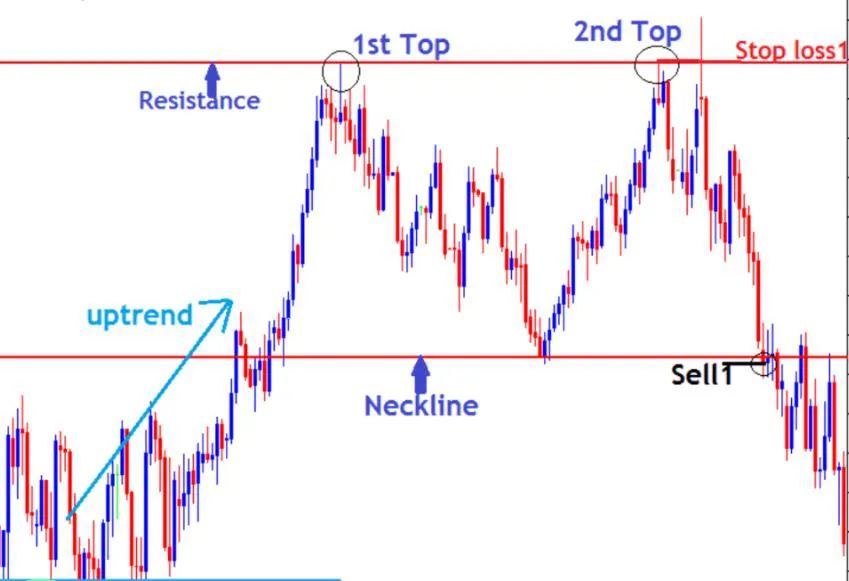
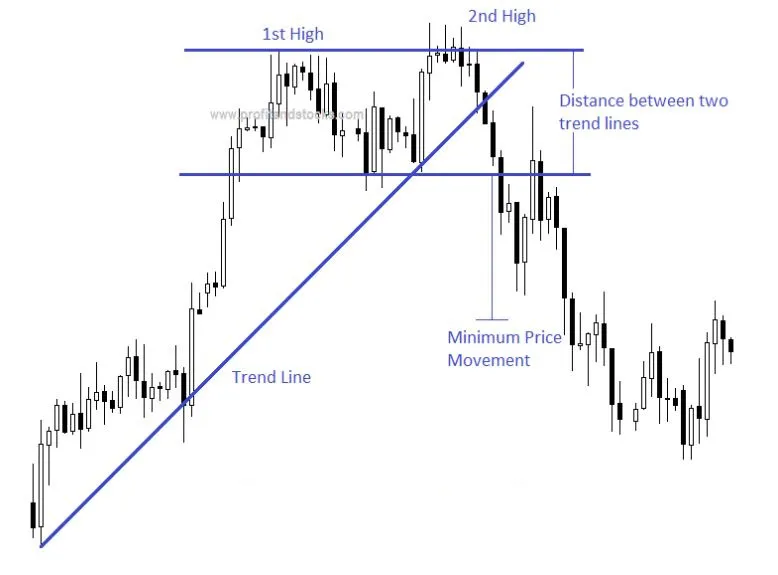
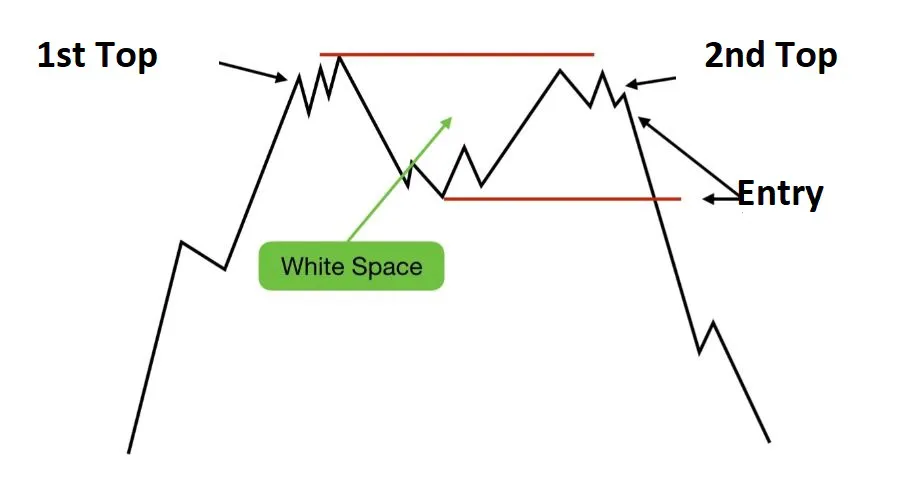
    • When the market is in a strong bullish trend, with prices steadily increasing. The price reaches a high point, and then starts to pull back forming first Top
    • The price finds support at a certain level, which creates a valley and pulls up.
    • The price then rises again, but fails to reach the previous high and begins to fall again.
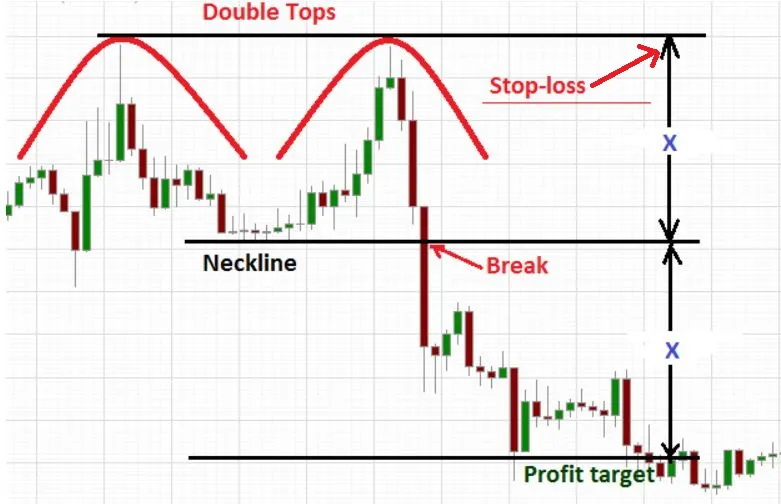
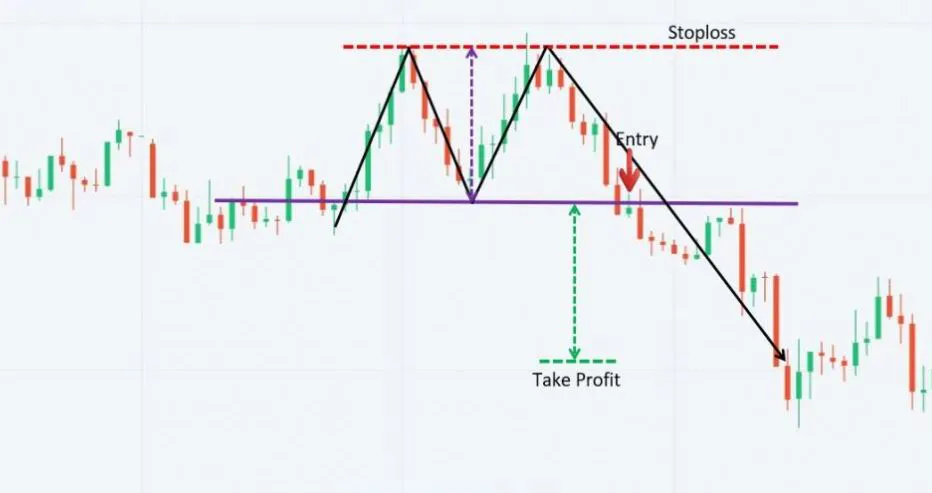
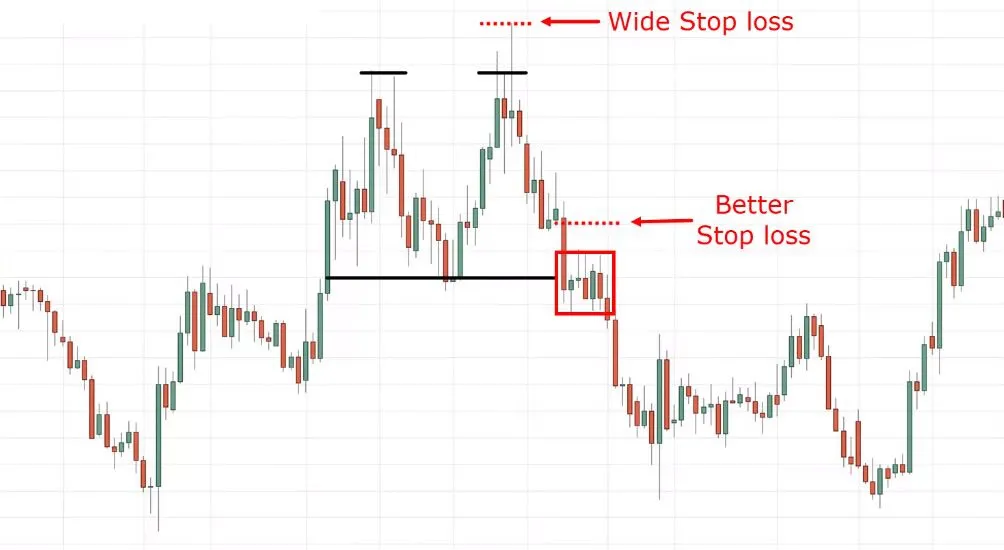
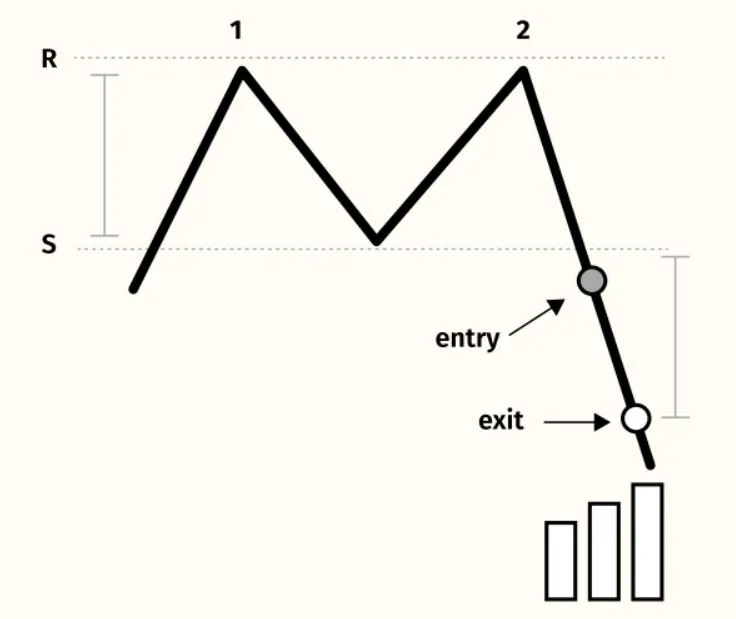
    • The support level created by the valley connects the two high points, forming the neckline.
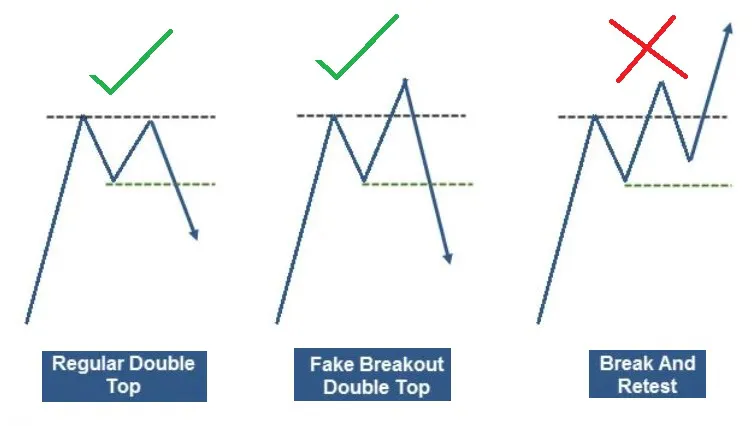
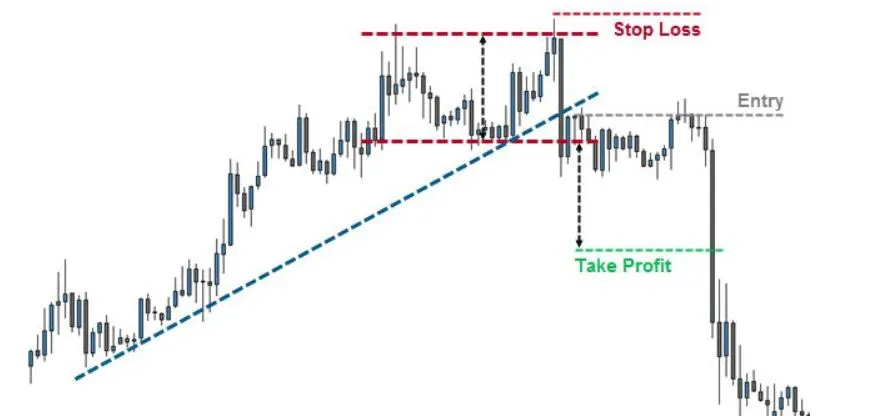
    • If the price falls below the neckline, it signals a potential trend reversal and a bearish move.
    • Increase in volume near the Neck line determines the perfect breakout

How to take position in the market?
- Depending on trading psychology and individual risk, some Traders follow below rules to enter into positions.

  1. Entry

    • Enter a short trade when the price breaks below the neckline, confirming the Double Top pattern.
    • To confirm the breakout, wait for the price to close below the neckline on a significant volume.
  2. Target

    • The price target can be set equal to the distance between the neckline and the highest point of the pattern, projected downwards from the neckline.
    • Alternatively, you can look for support levels along the way and use them as potential exit points.
  3. Stop Loss

    • Place your stop loss above the second high of the pattern, where the price failed to break through the resistance level.
    • This level can act as a potential resistance level in the future, and a breakout above it would invalidate the Double Top pattern.
  • The Double Top pattern is typically a short-term pattern, and may not be as useful for longer-term traders or investors.
  • In double top pattern there are two tops, and that are roughly at the same price level and may not be the same price level. In some cases, the second top may be slightly higher or lower than the first top.
  • Example-1 : Regular Double Top pattern


    Example-2 : Double Top pattern with Entry, Stoploss and Entry point


    Example-3 : Double Top pattern at strong Resistance zone


    Example-4 : Double Top pattern


    Example-5 : ReveDouble Top pattern


    Example-6 : After Double Top pattern market retrace back to neck line


    Example-7 : Double Top pattern having False breakout


    Share the App - Share Alpha