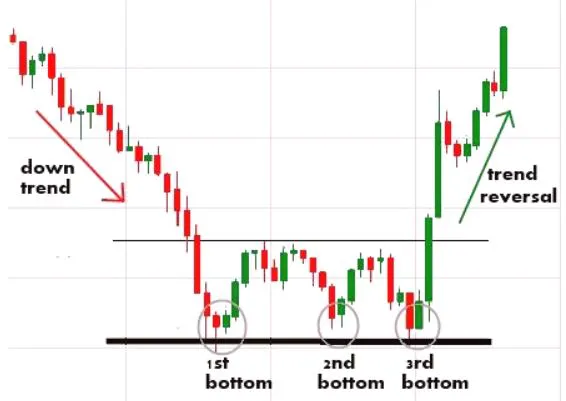
- It's a bullish reversal chart pattern that forms after a downtrend.
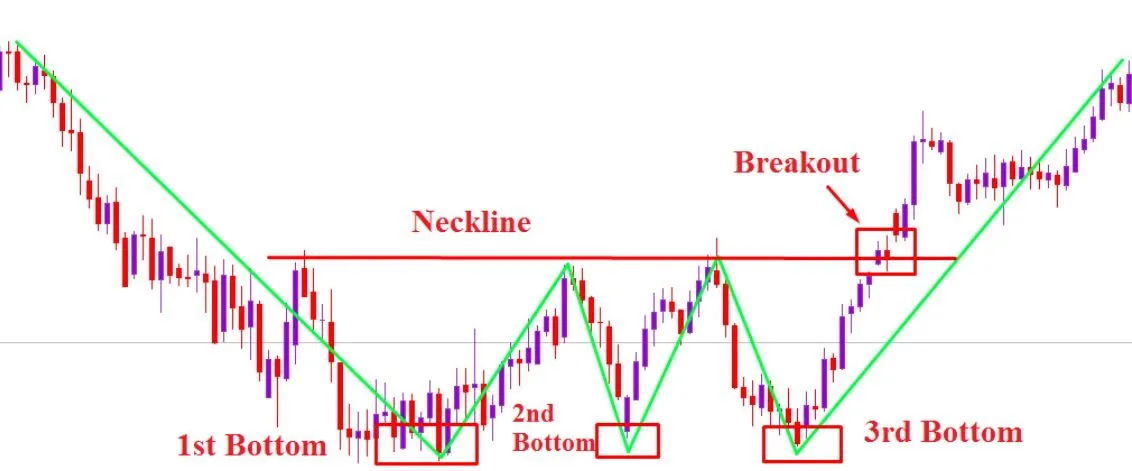
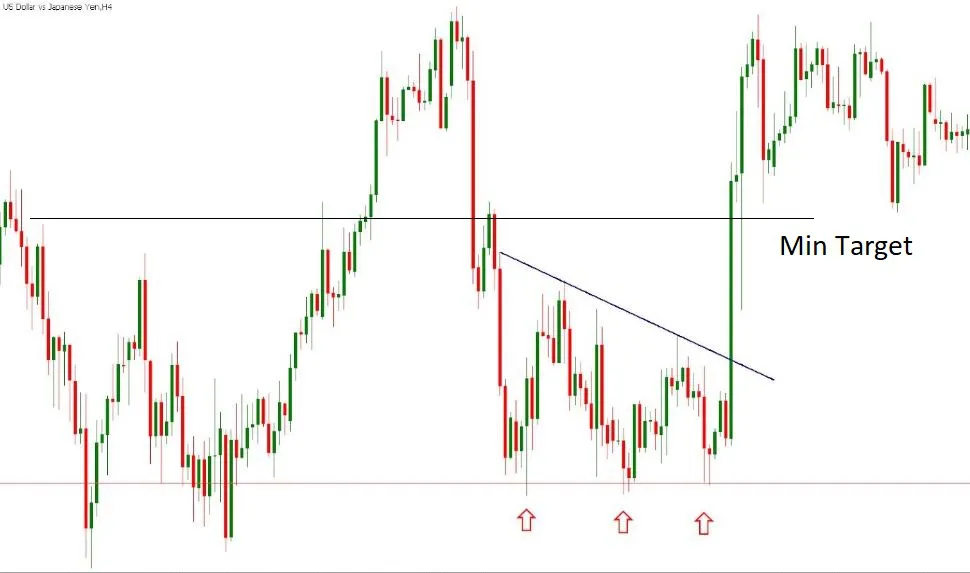
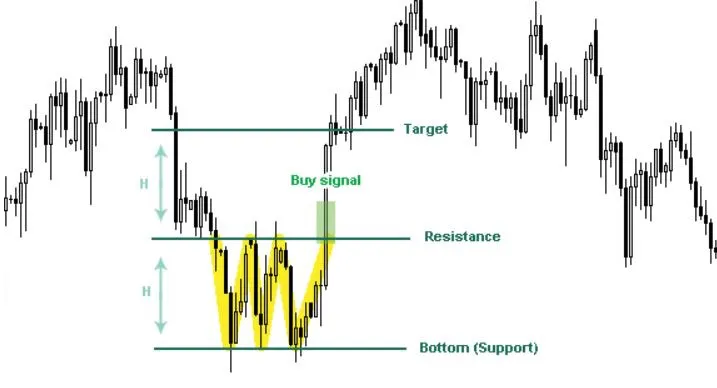
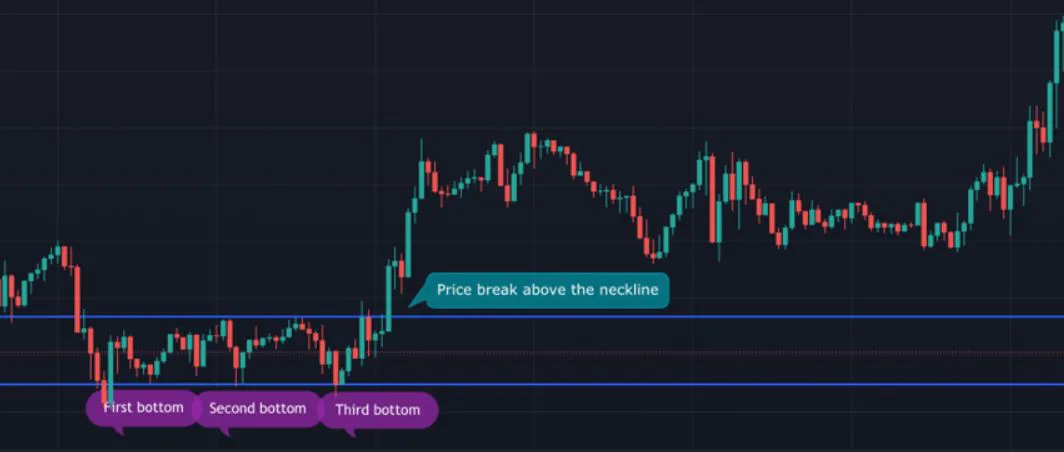
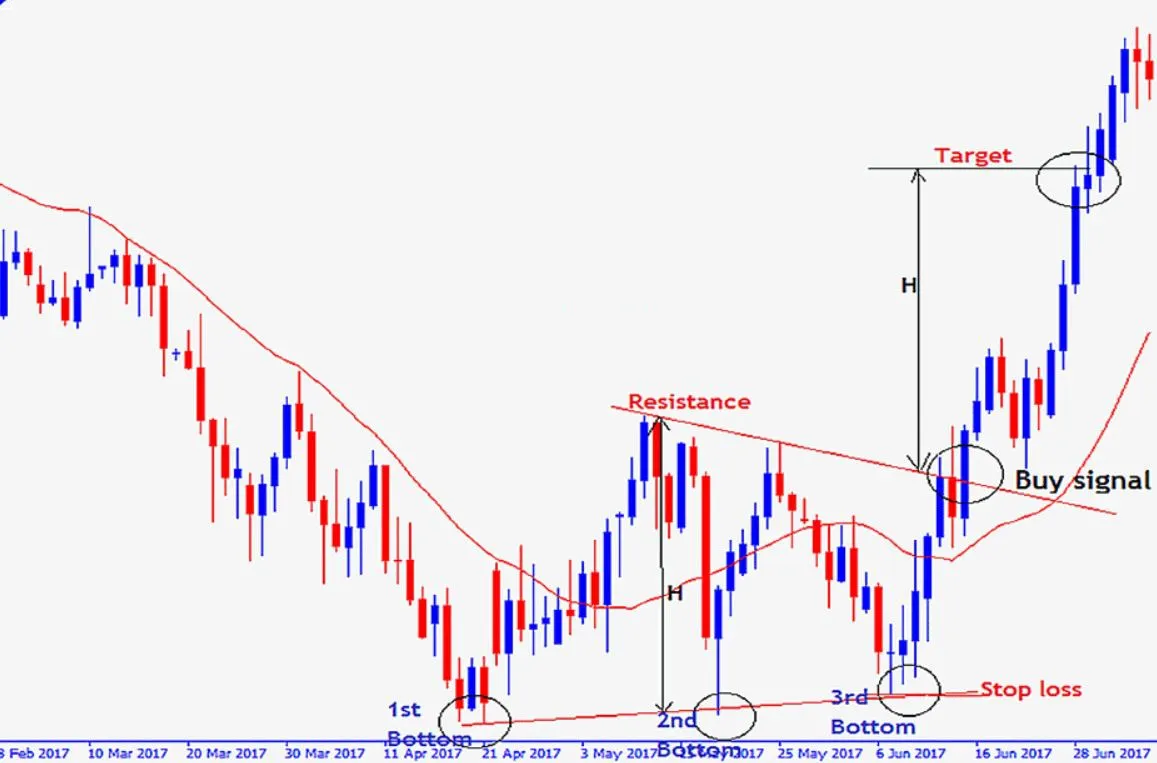
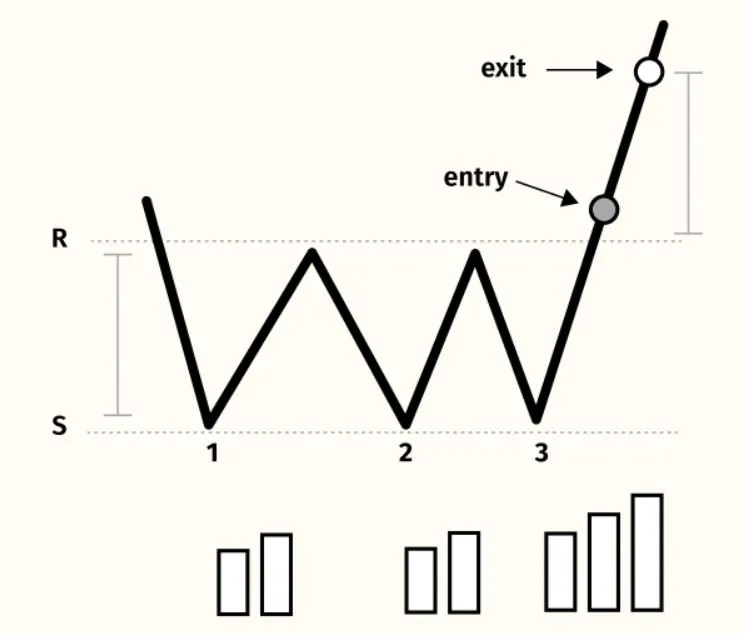
- The price needs to break above the resistance level or "neckline" formed by the two intermediate peaks to confirm the pattern.
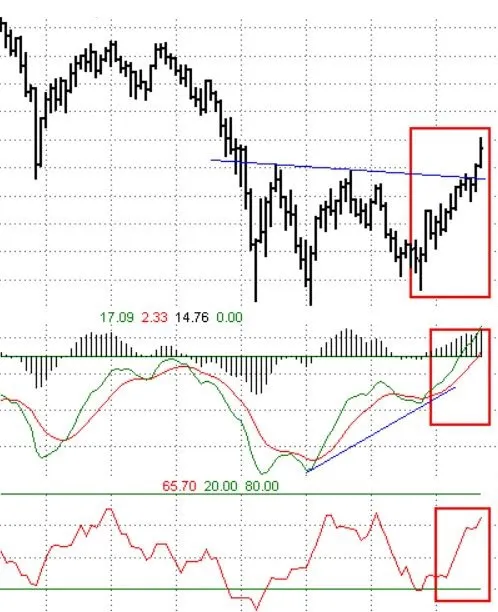
- Volume should increase as the price approaches the bottom of the pattern, indicating accumulation.
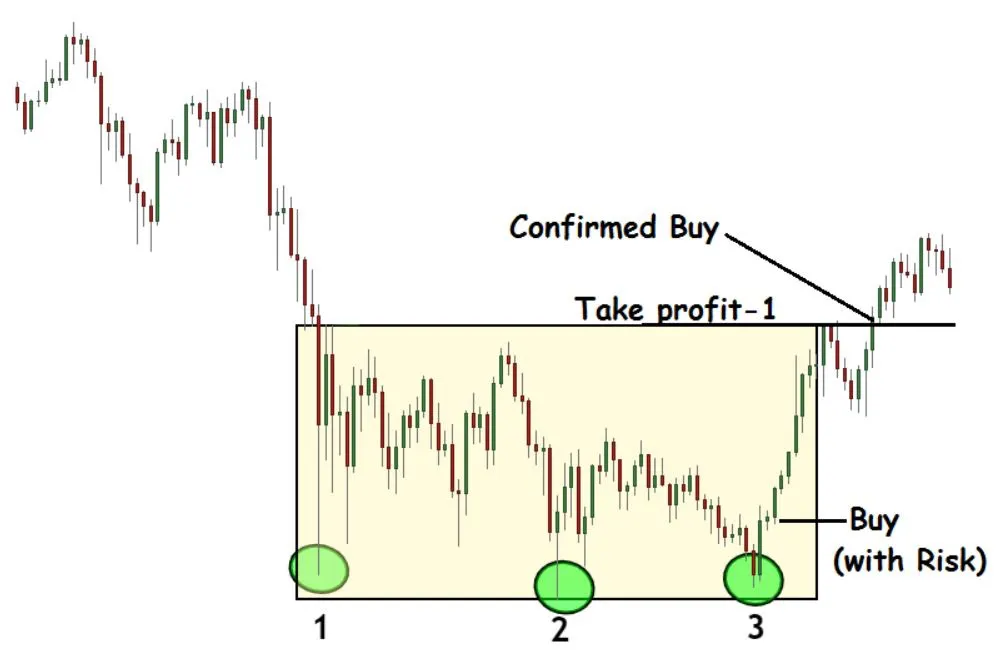
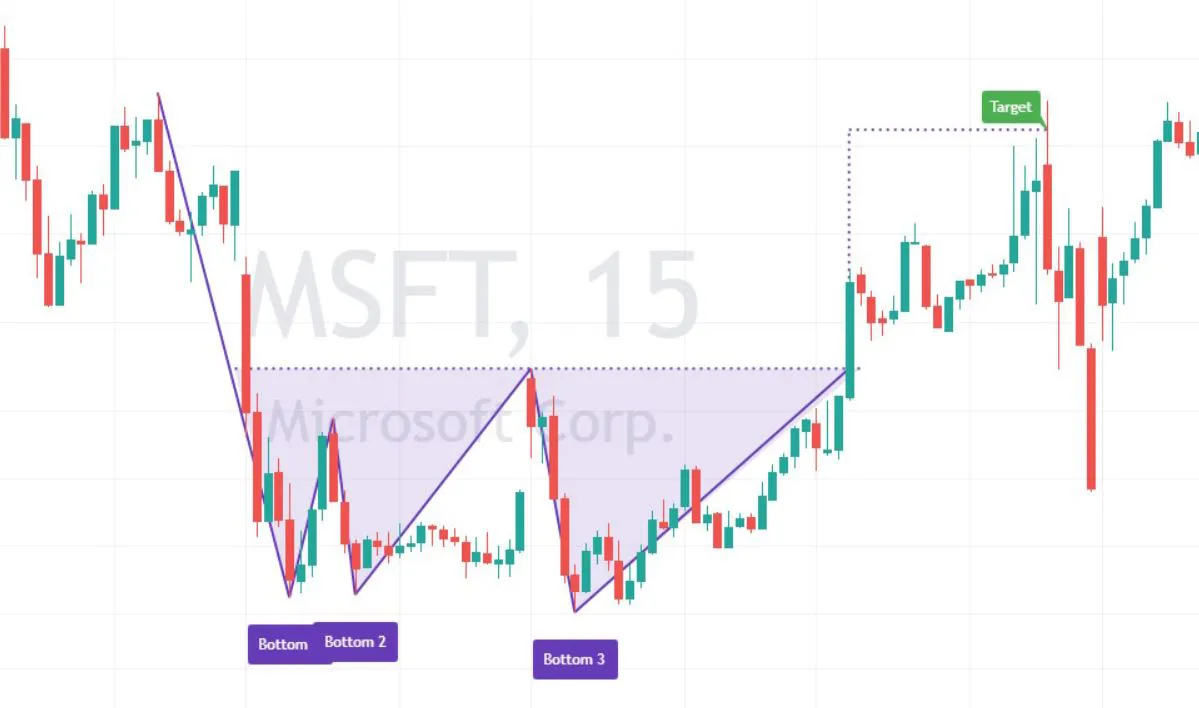
- The pattern is not truly valid until the price moves above the peak established between bottoms #2 and #3.
- Traders may use this pattern to identify potential buying opportunities.
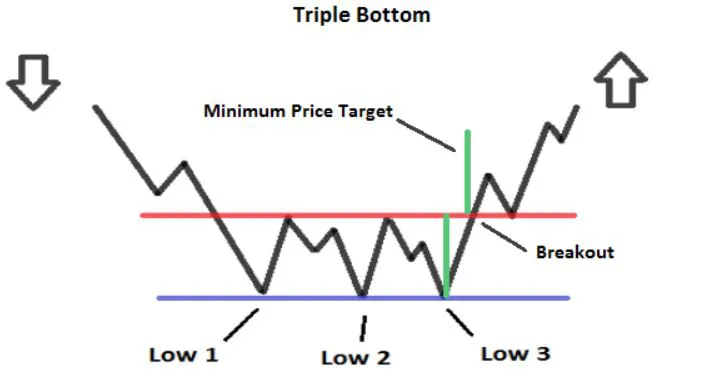
Triple Bottom
This pattern is exactly opposite to Triple Top pattern.
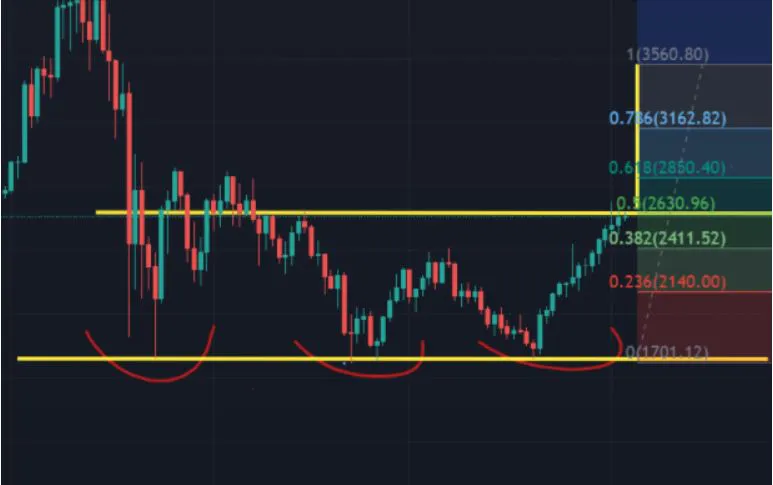
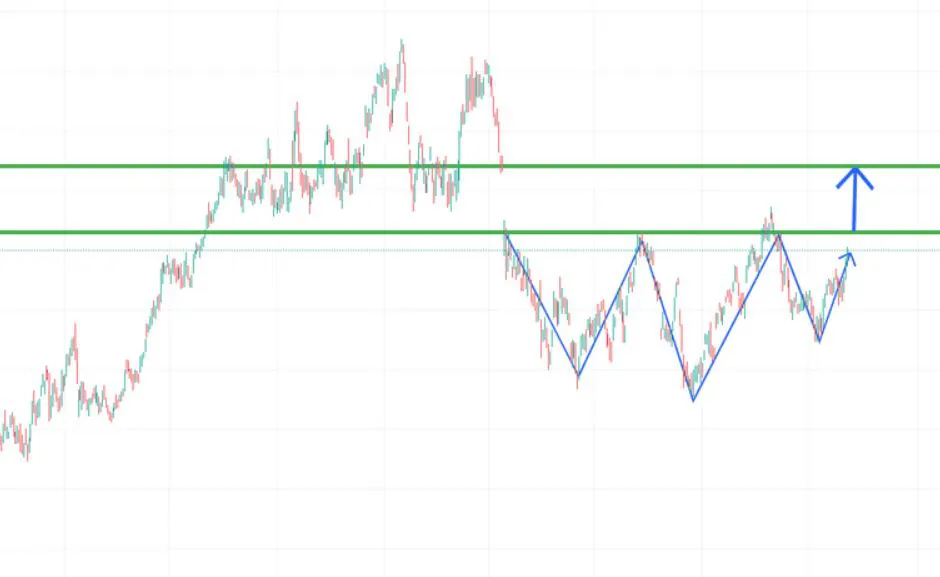
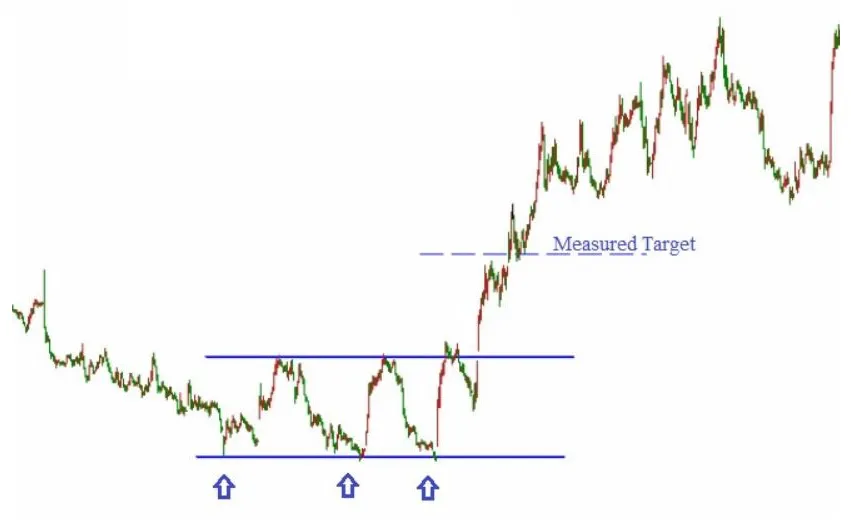
The Triple Bottom pattern is a bullish reversal pattern that is formed by three consecutive lows at approximately the same price level.
The Triple Bottom formation occurs when a stock price falls for a while to new lows, bounces back with moderate rally. Falls again to test previous low, but buyers push it up. Repeats third time creating three bottoms at same level. Finally buyers win the battle and price moves significantly higher