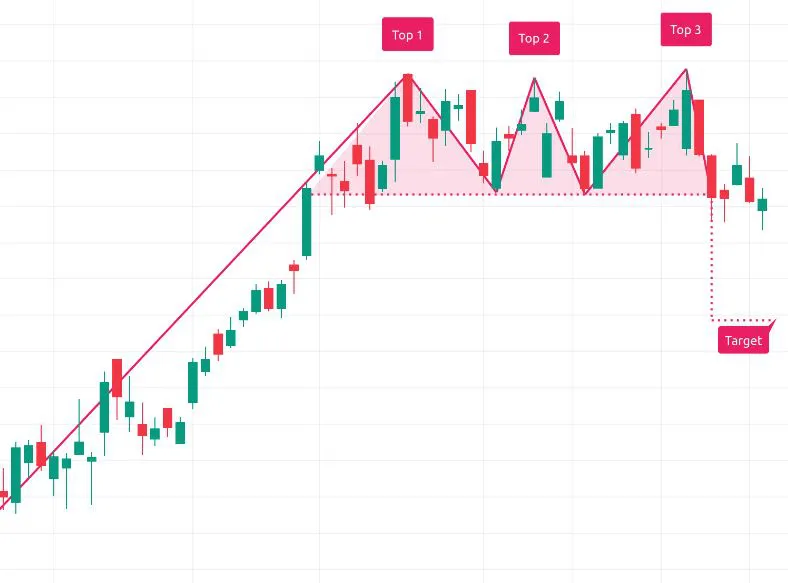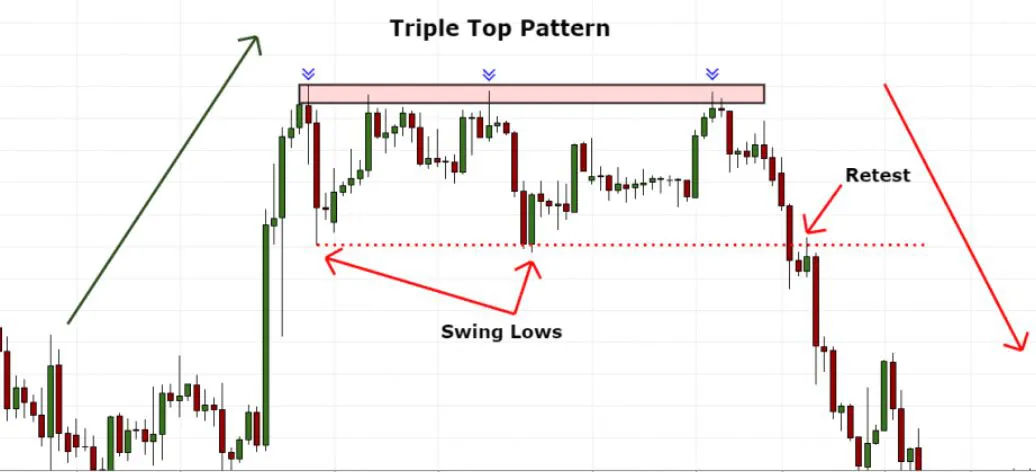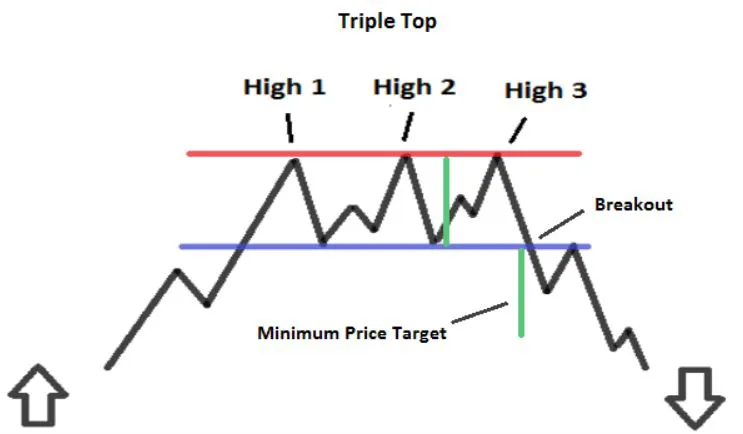
- A triple top chart pattern is a bearish reversal chart pattern that is formed after an uptrend.
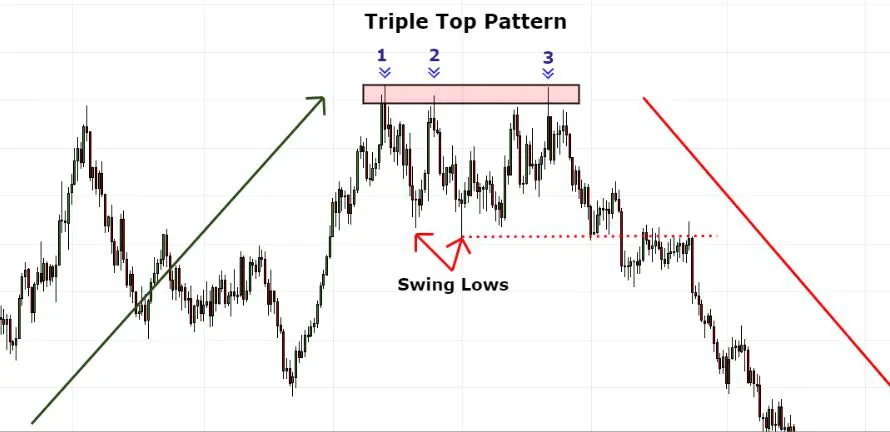
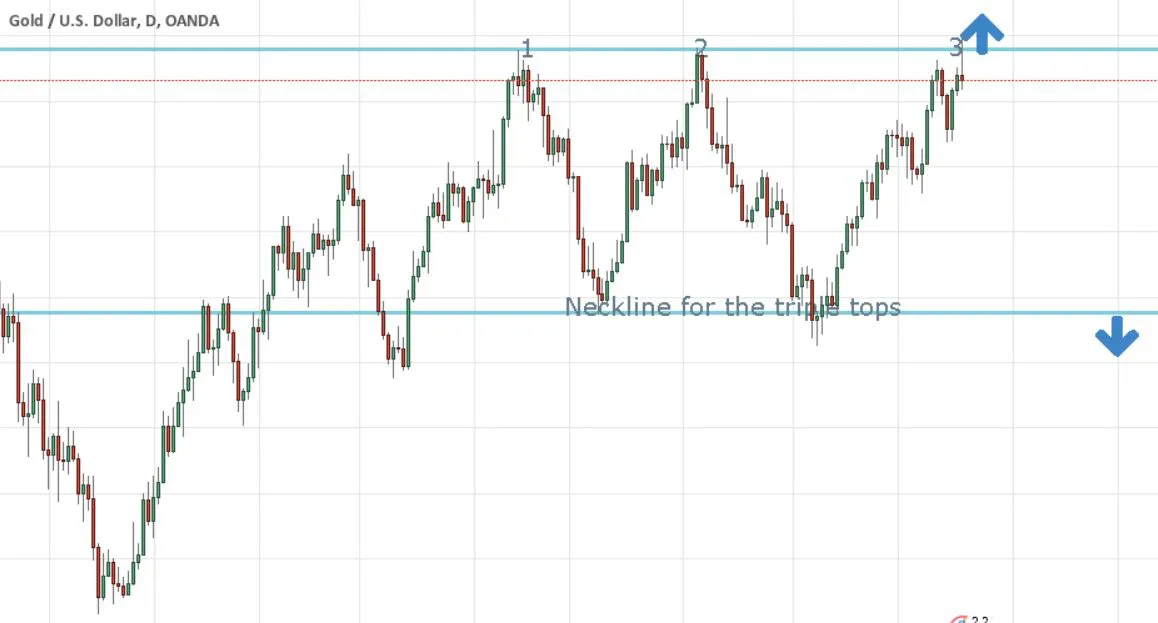
- It consists of three peaks peaks below a resistance level.
- Alternatively, it can also occur with three peaks that occur above a support level called as neckline, which is going to break
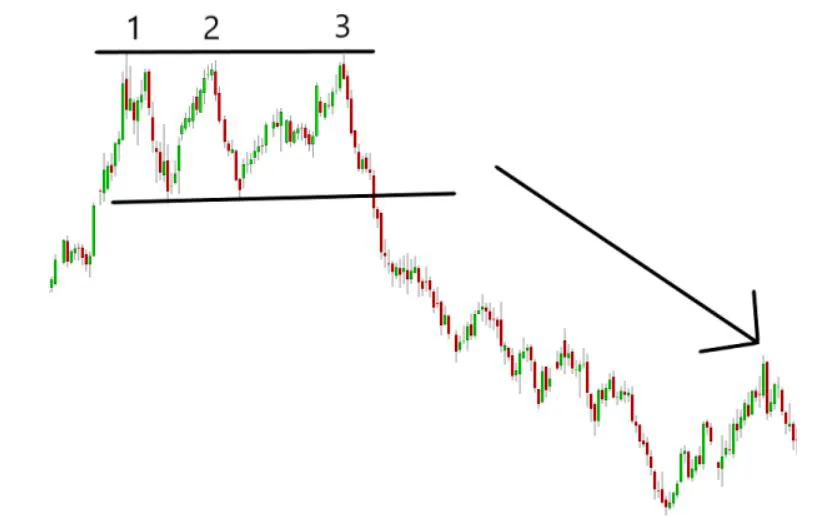
- These peaks suggests accumulation is taking place, which is a sign of start of a trend
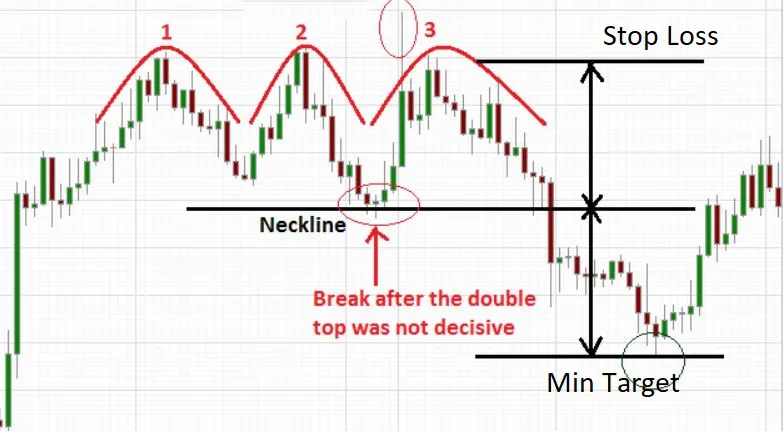
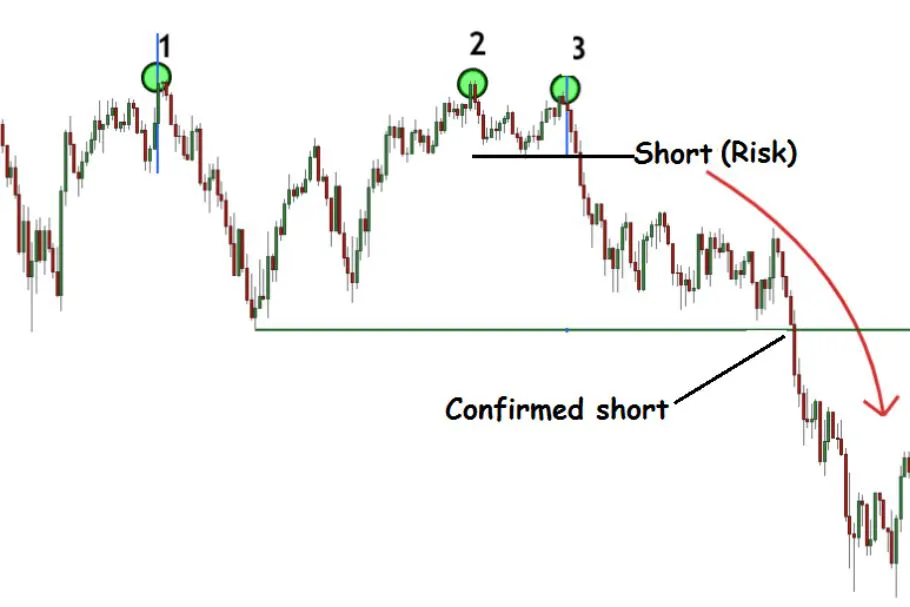
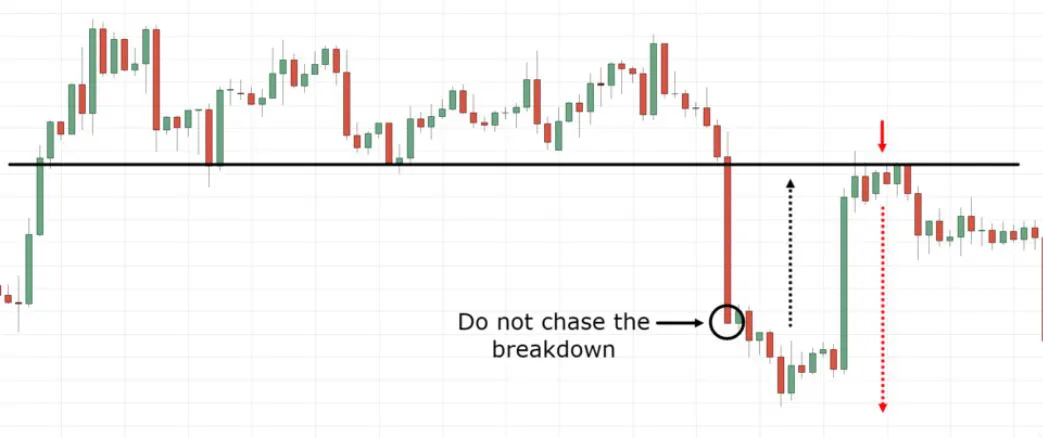
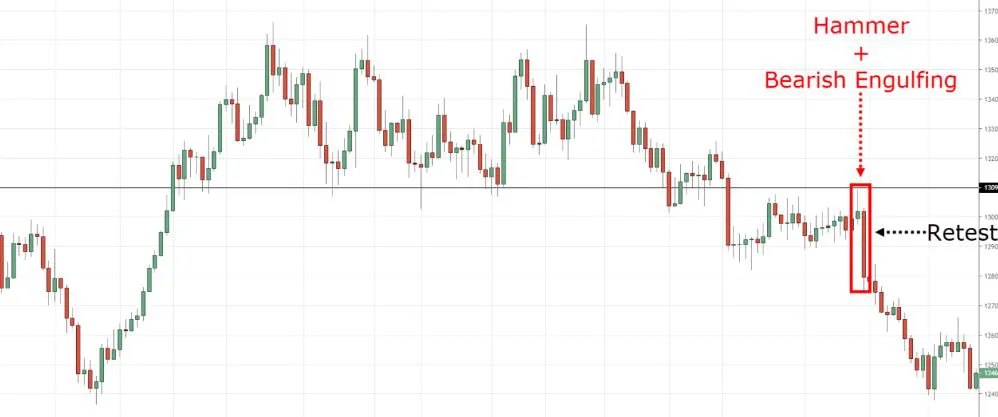
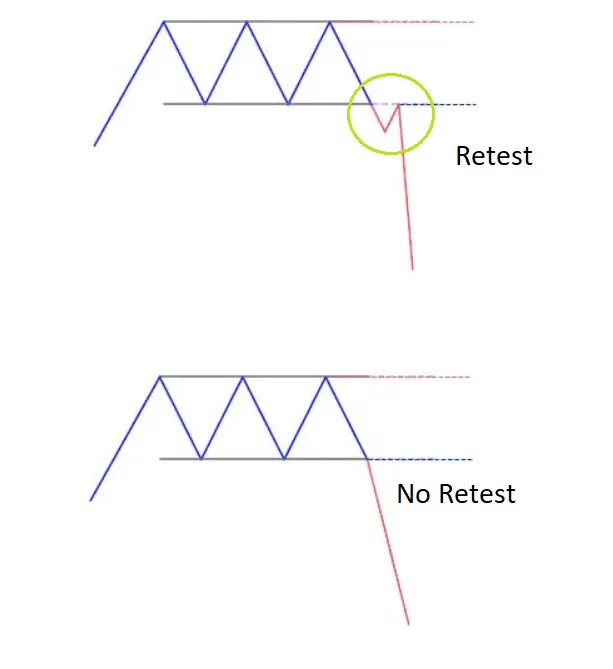
- The pattern is not complete until the stock closes below the lows made between tops #2 and #3, means breakdown of support level/neckline.
- The perfect breakout is determined by an increase in volume near the neckline.
triple top
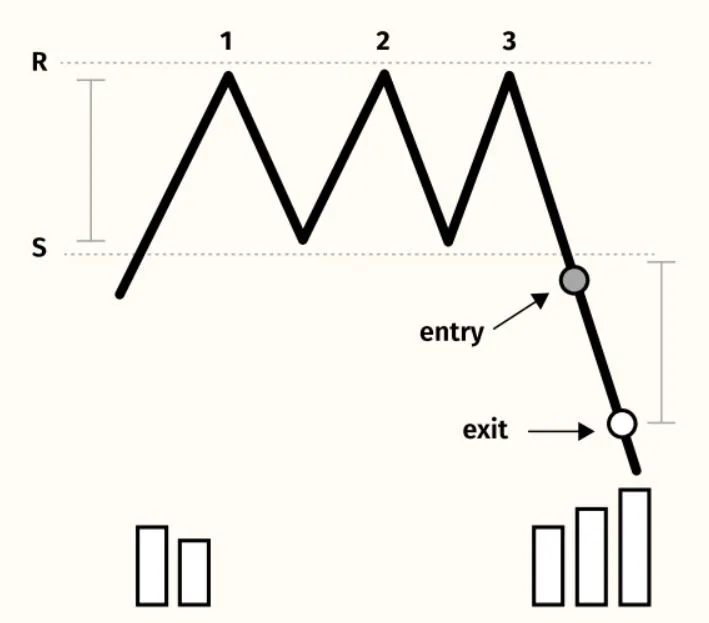
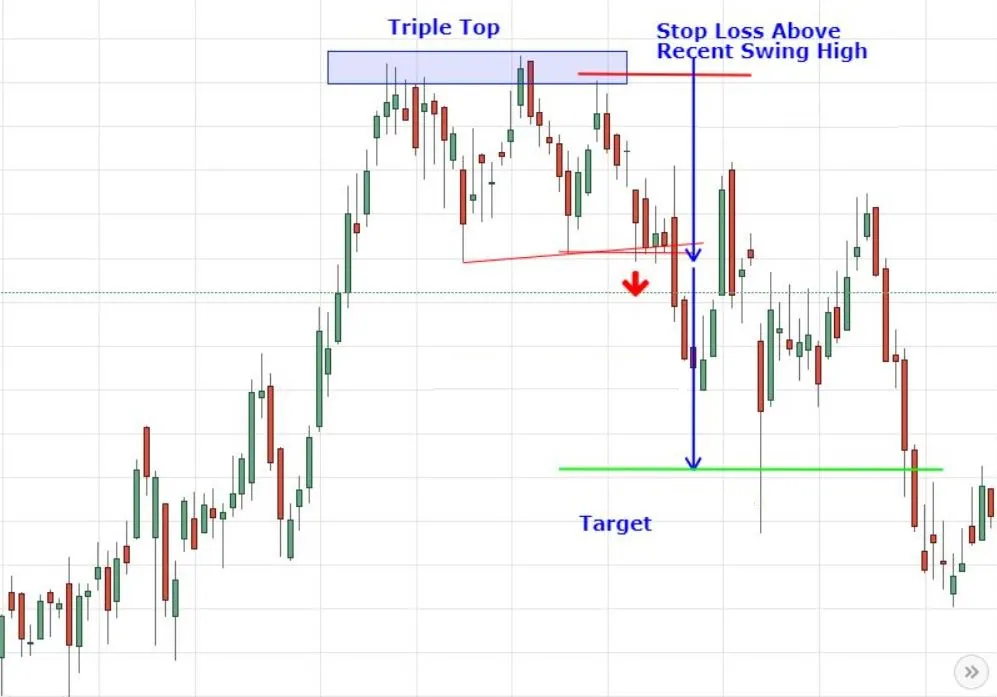
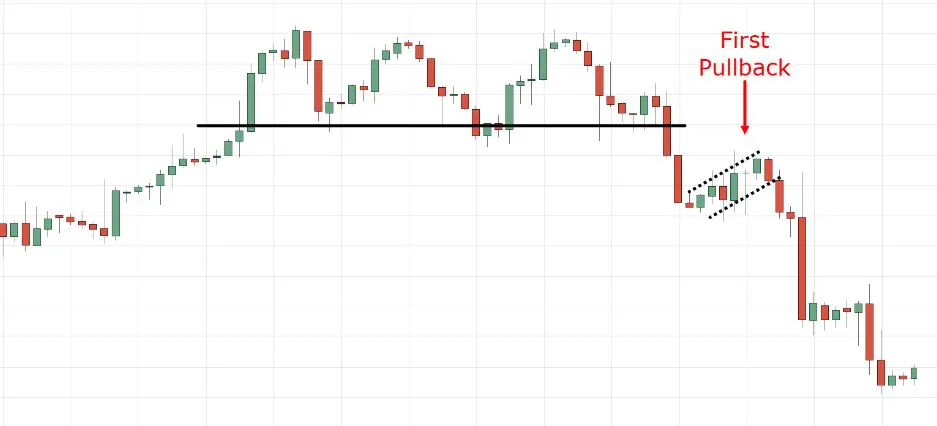
The triple top candlestick pattern is a technical analysis pattern that occurs when the price of an asset creates three peaks at approximately the same price level, followed by a price decline.
The pattern is formed when the price reaches a resistance level and is unable to break through it. The first two peaks are usually smaller than the third one, and the pattern is considered complete when the price breaks below the support level formed by the troughs between the peaks.