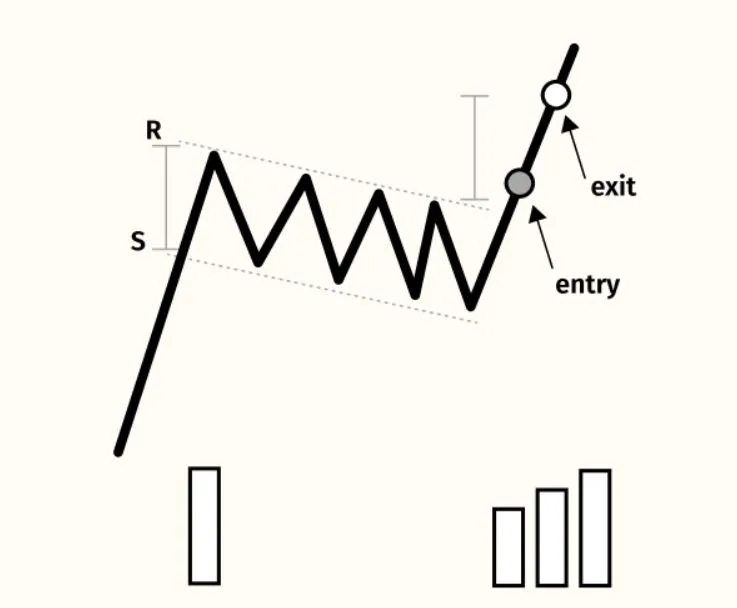
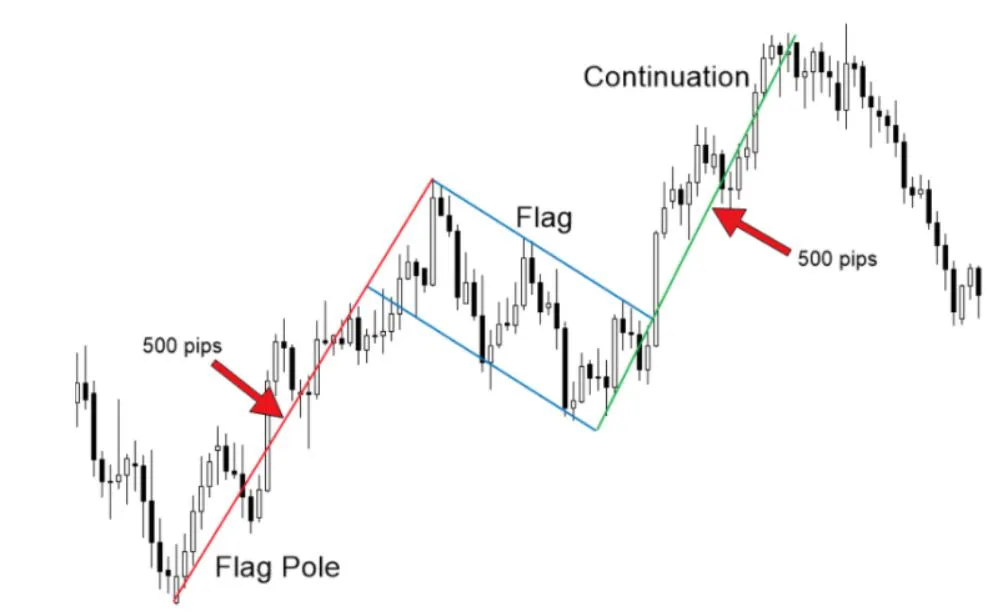
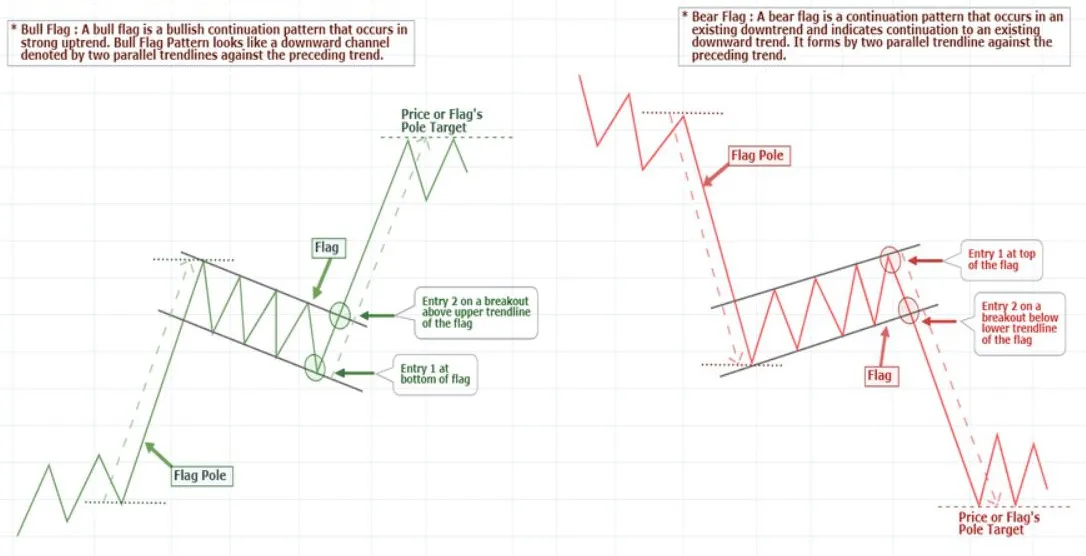
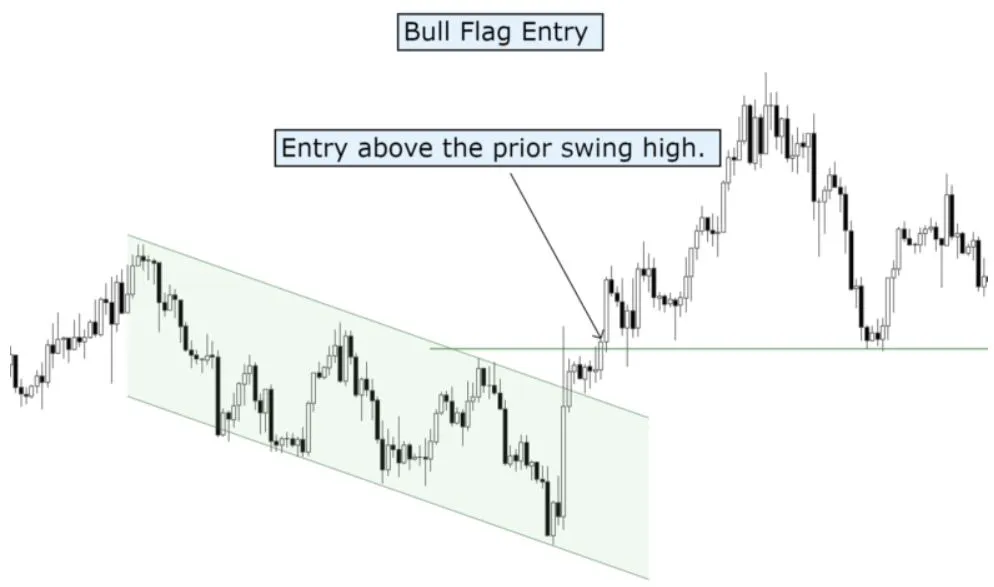
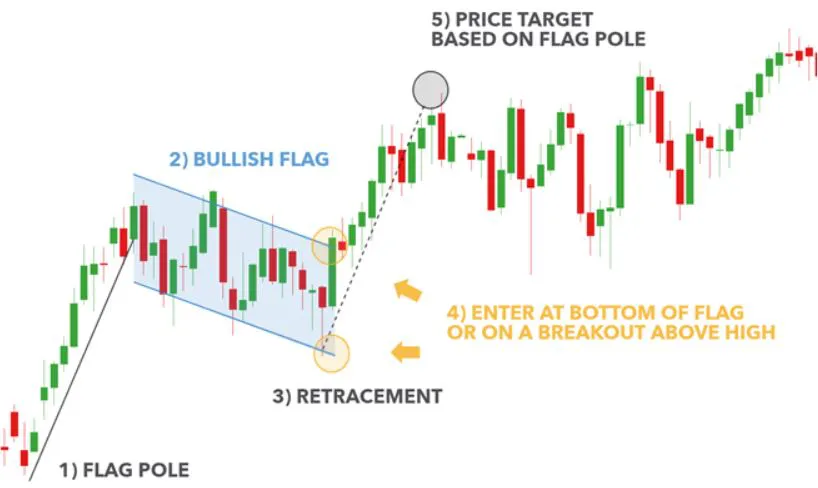
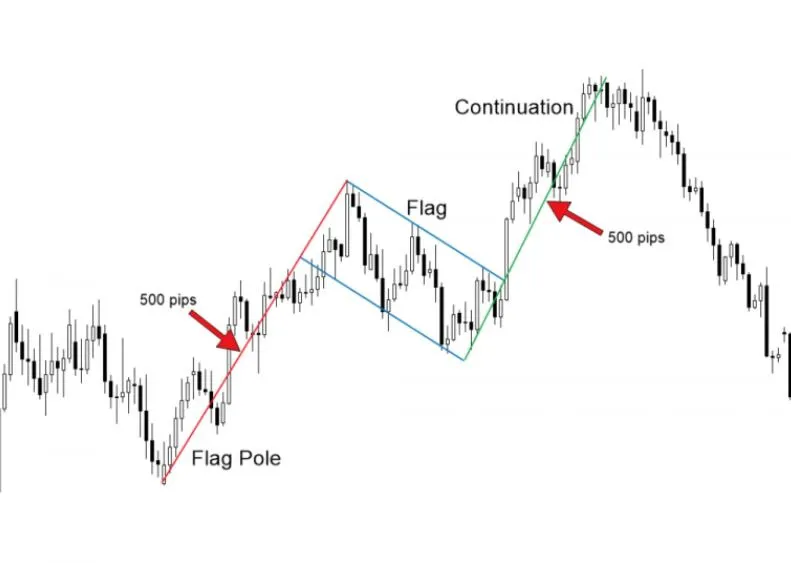
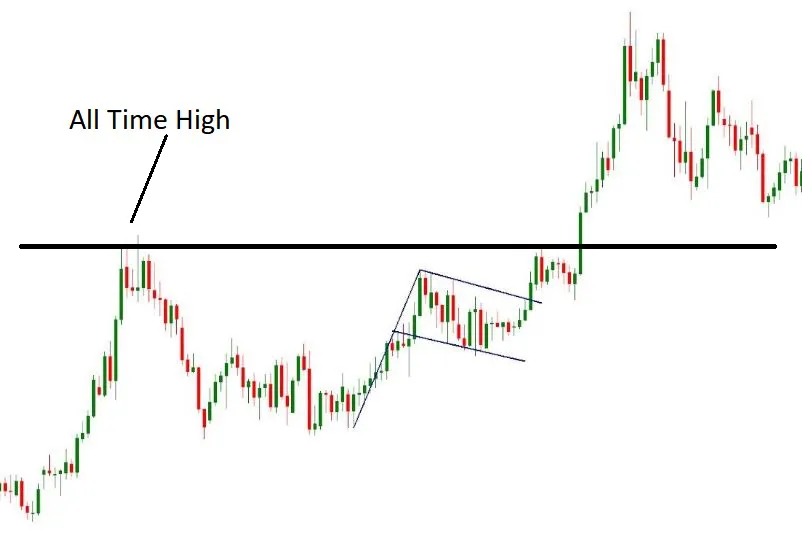
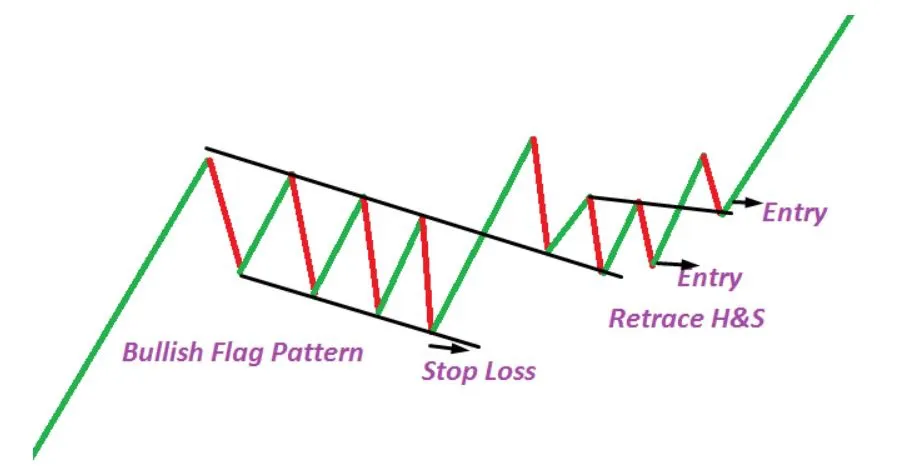
- Bullish Flag
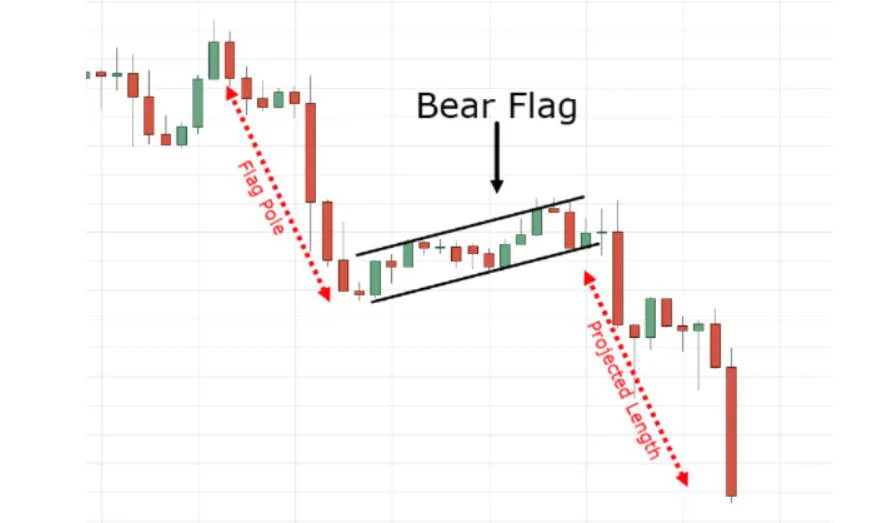
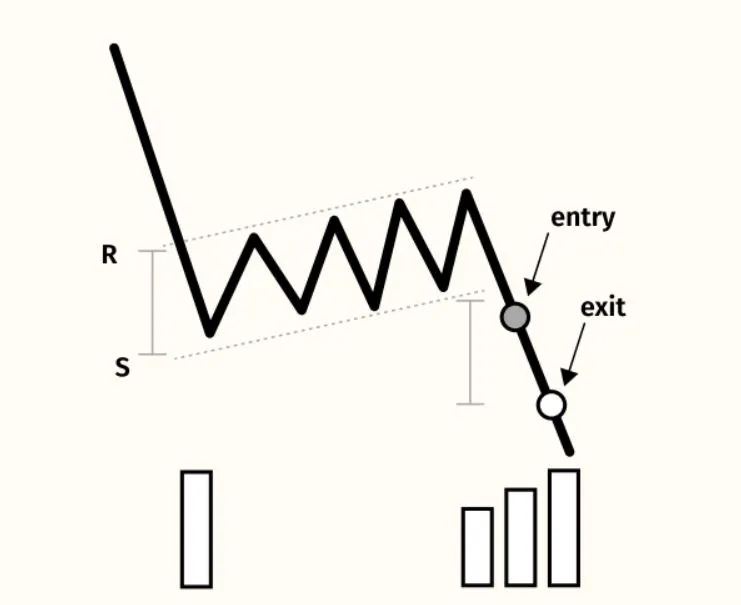
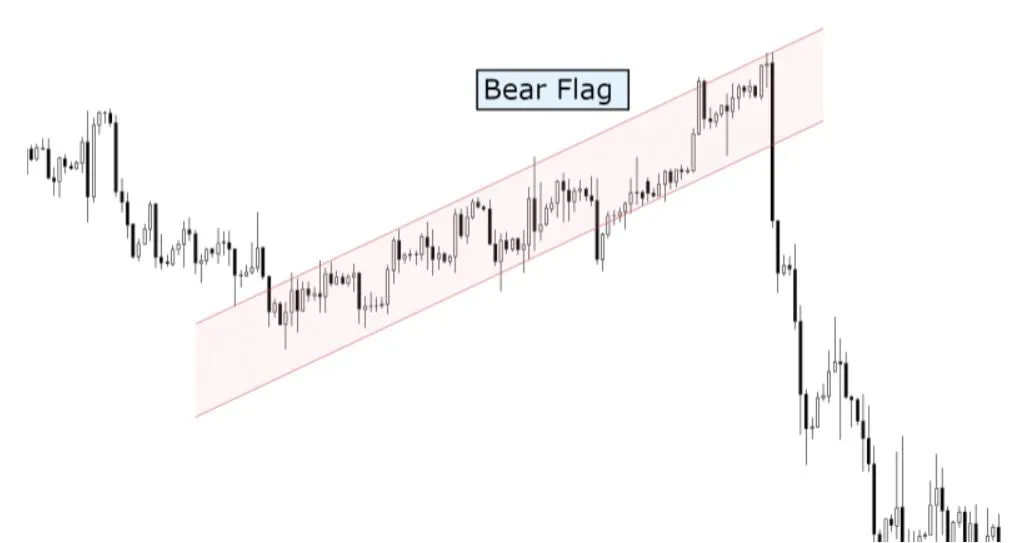
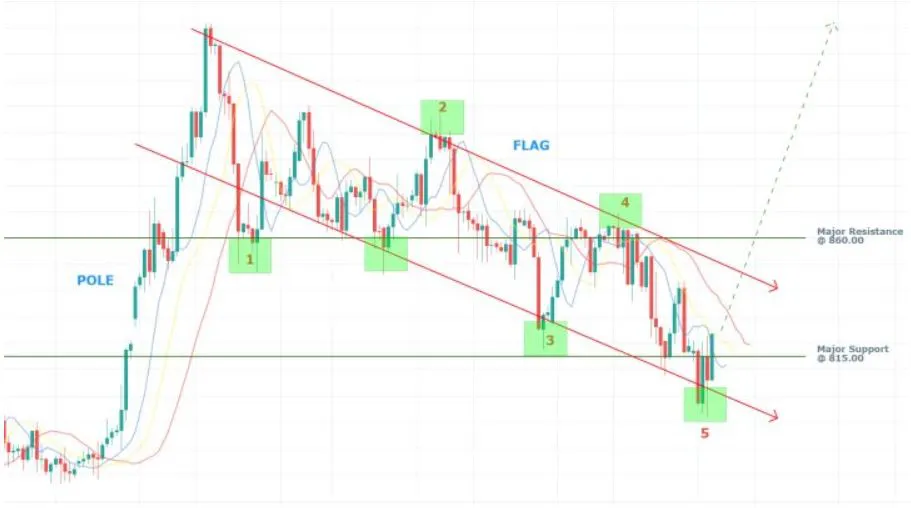
- Bearish Flag
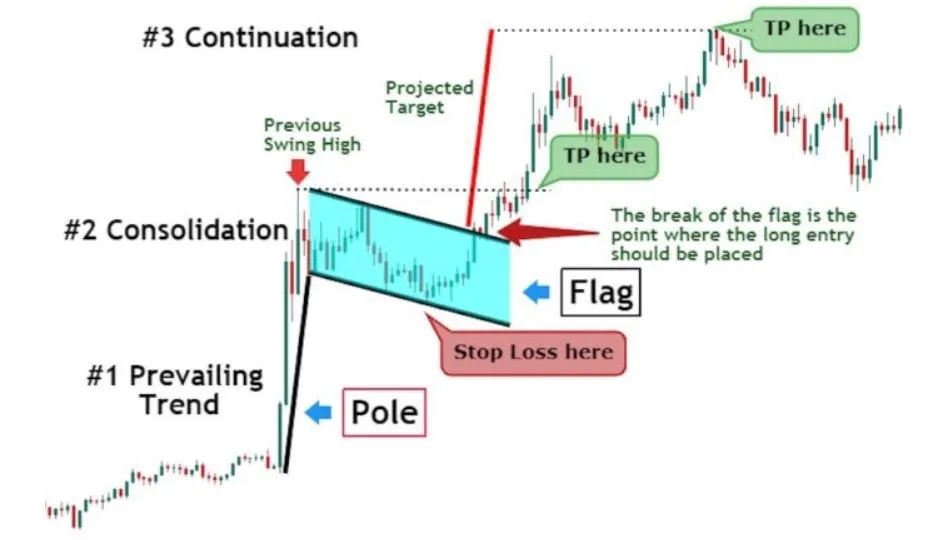
FLAGS
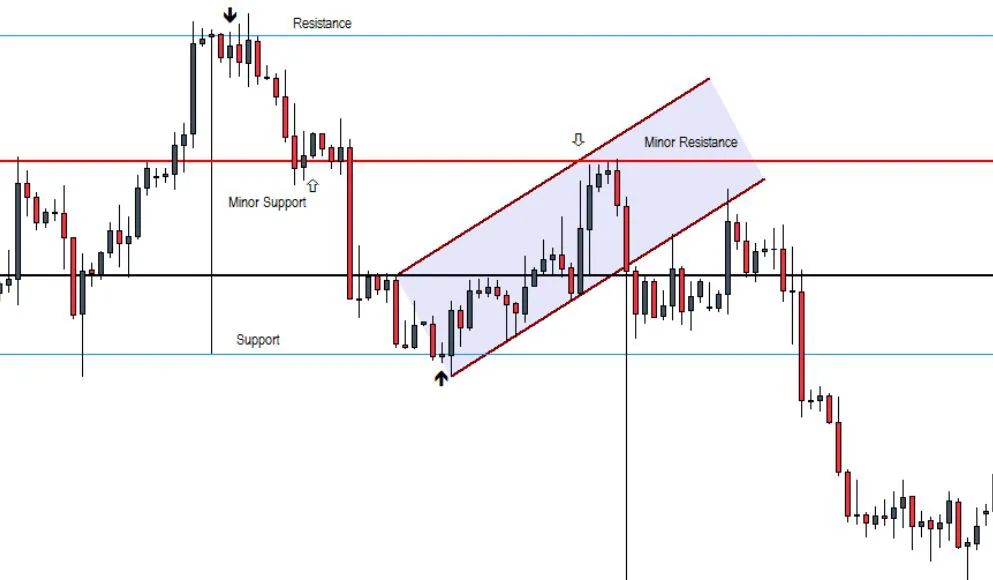
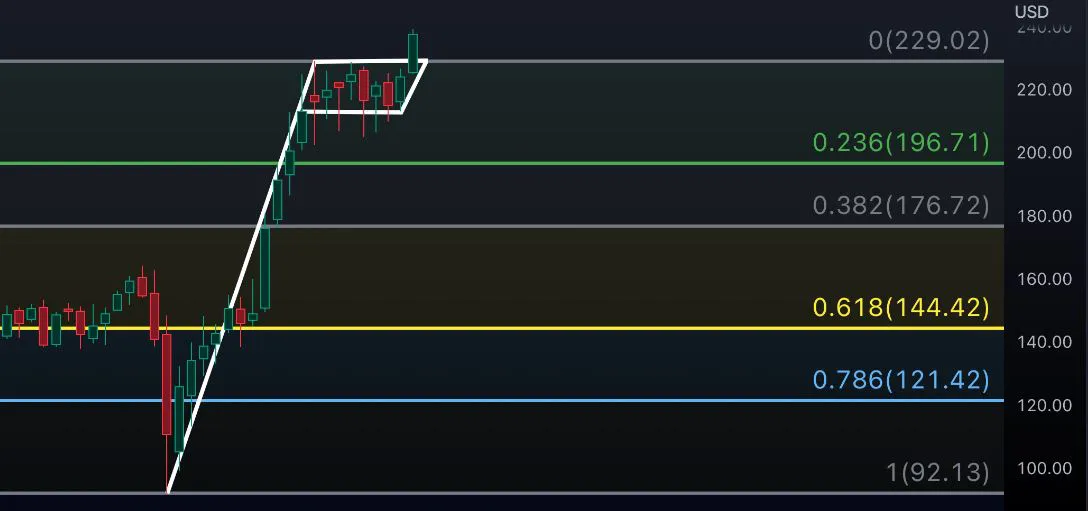
A flag is a pattern that forms when the market takes a breather (i.e, consolidation) after a big move, and trades within a tight narrow range.
The pattern looks like a rectangle or a parallelogram, and is usually tilted in the same direction as the current trend
Traders see the flag pattern as a sign that the original trend is likely to continue, and will look for a breakout in the same direction as the original move.
The key is that the flag must be confined between two parallel lines.