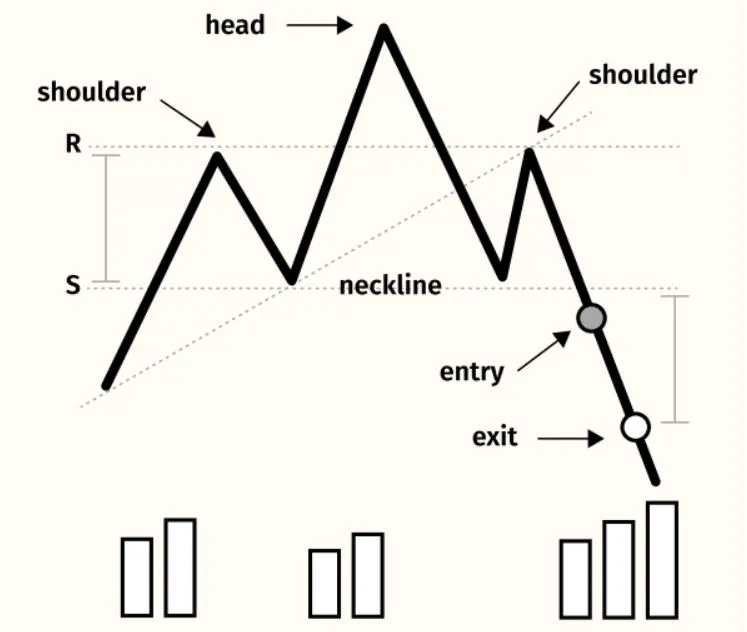
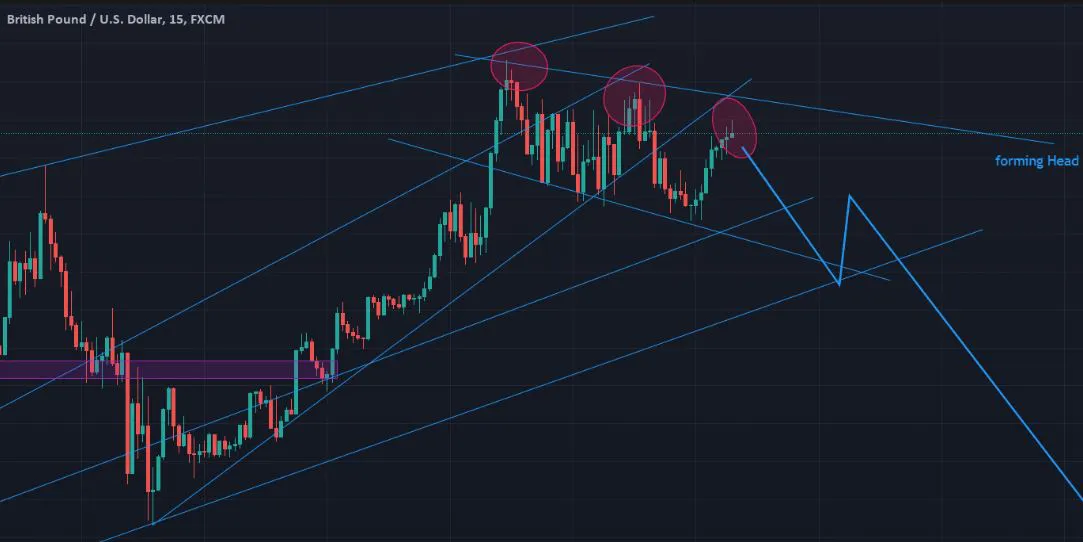
- Regular Head and Shoulders
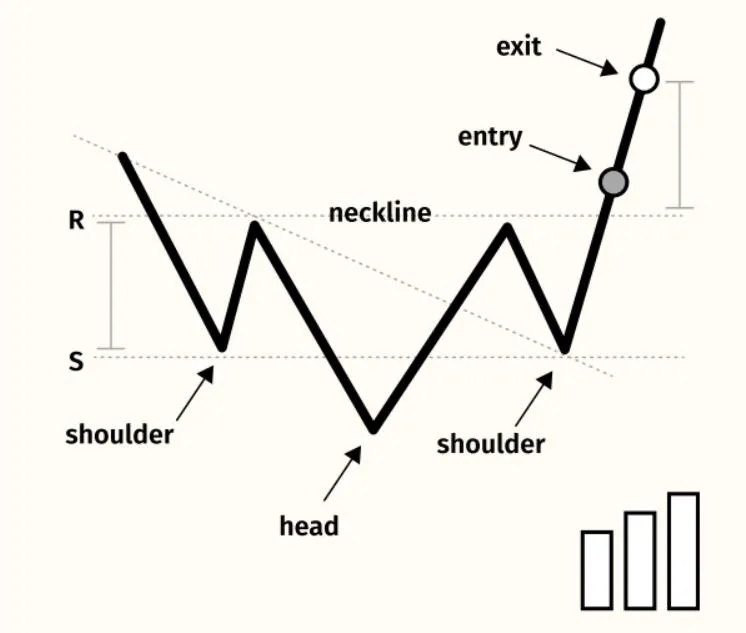
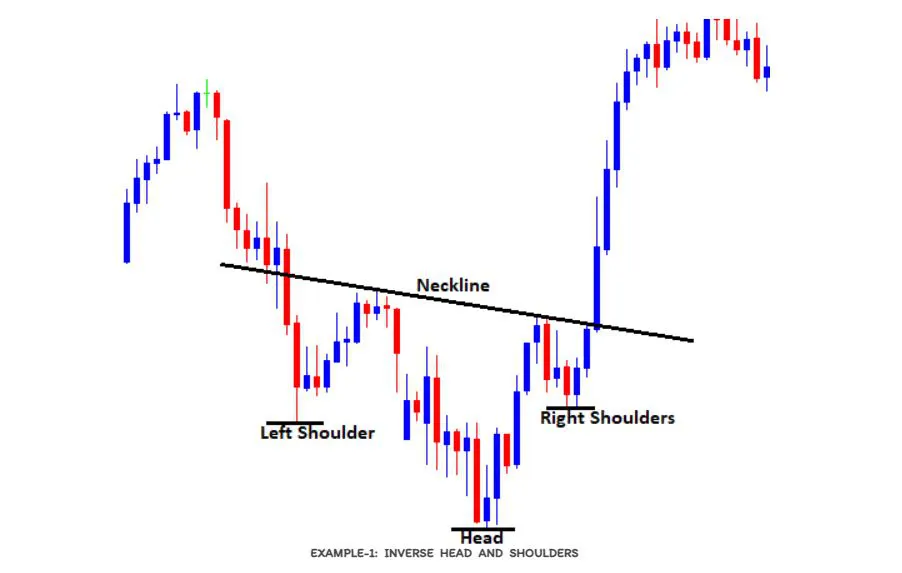
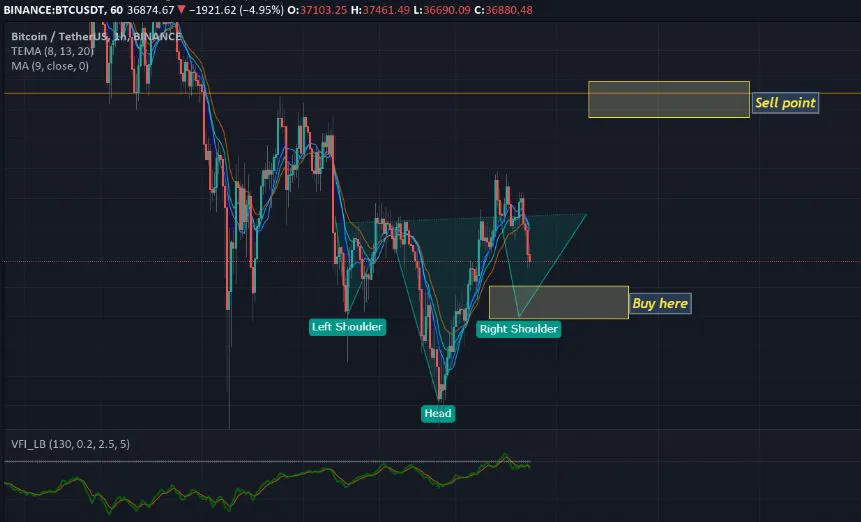
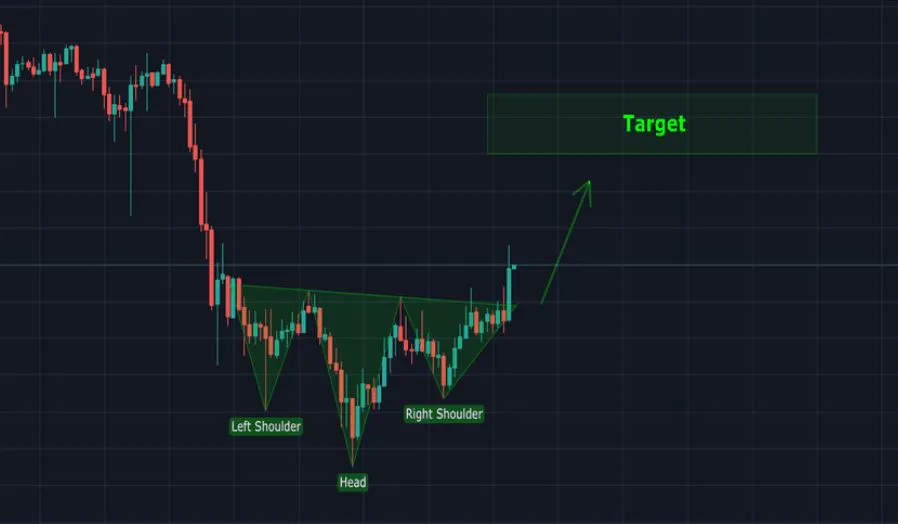
- Inverse Head and Shoulders
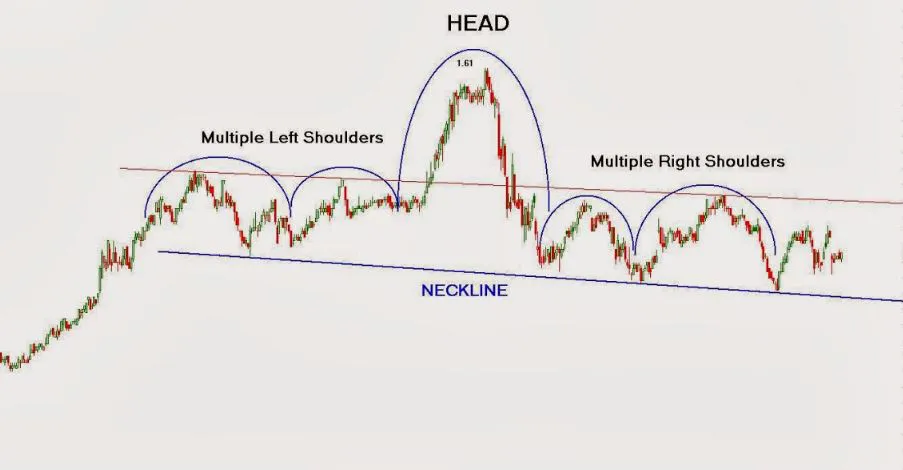
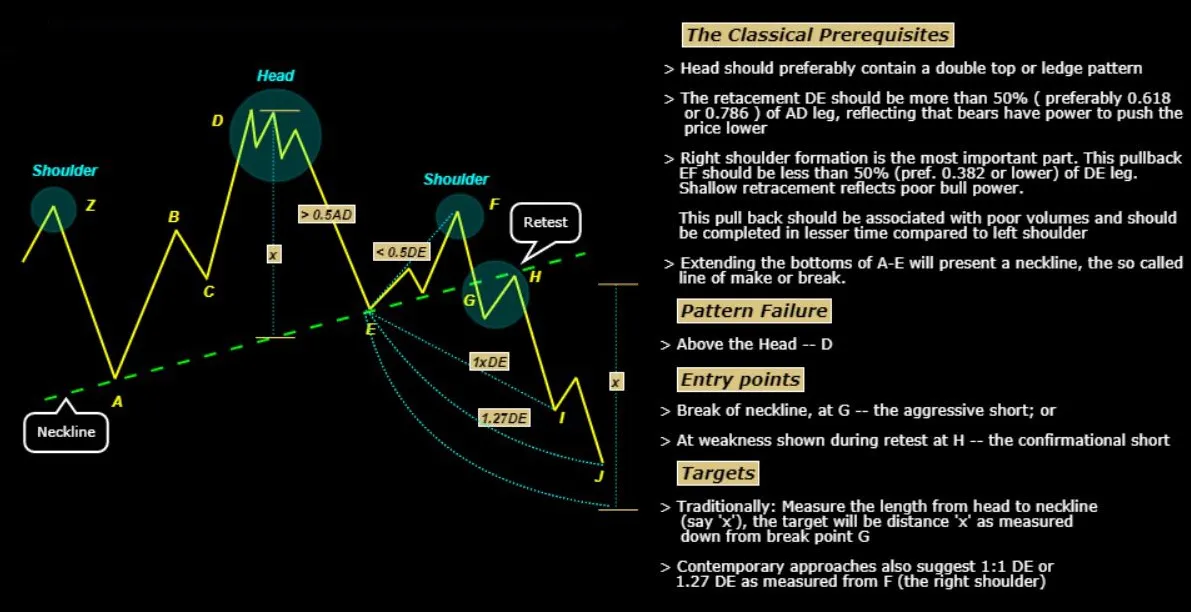
- Complex Head and Shoulders
HEAD AND SHOULDERS
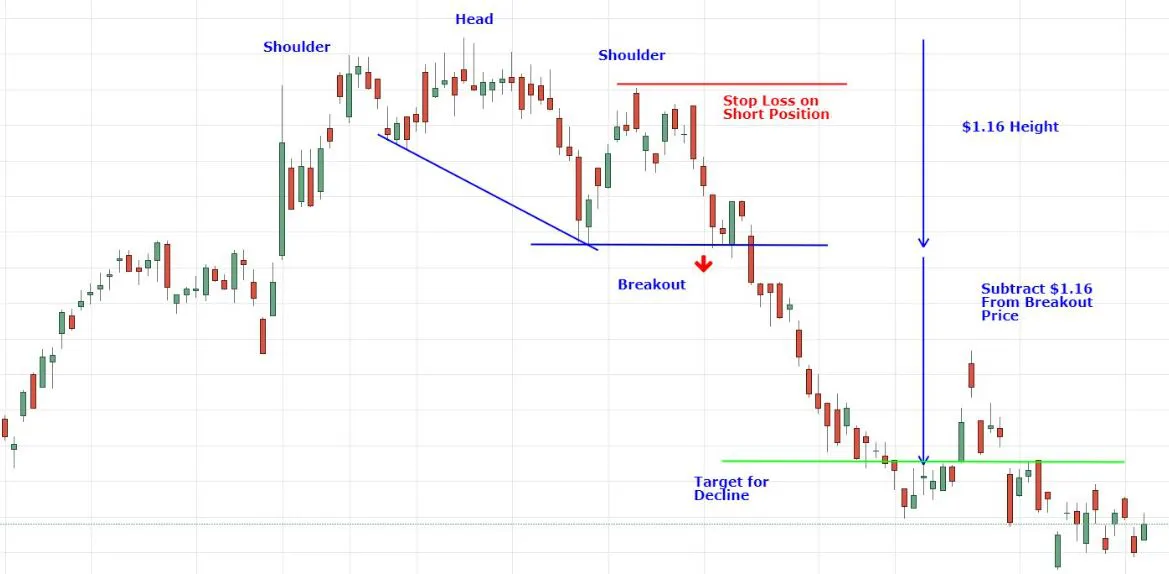
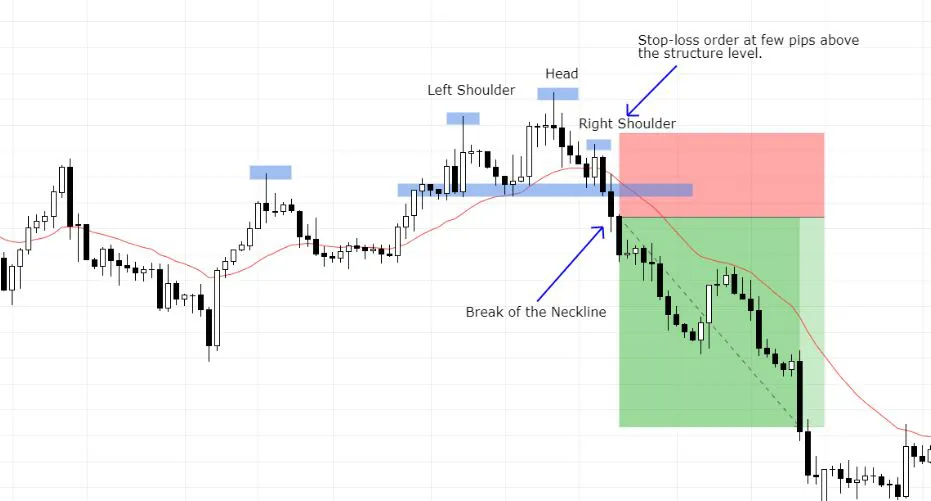
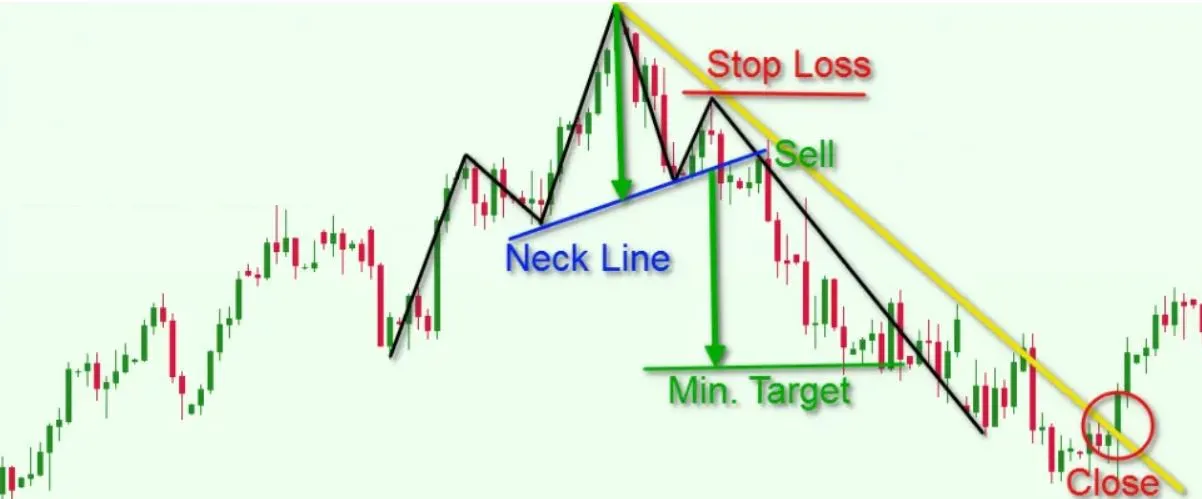
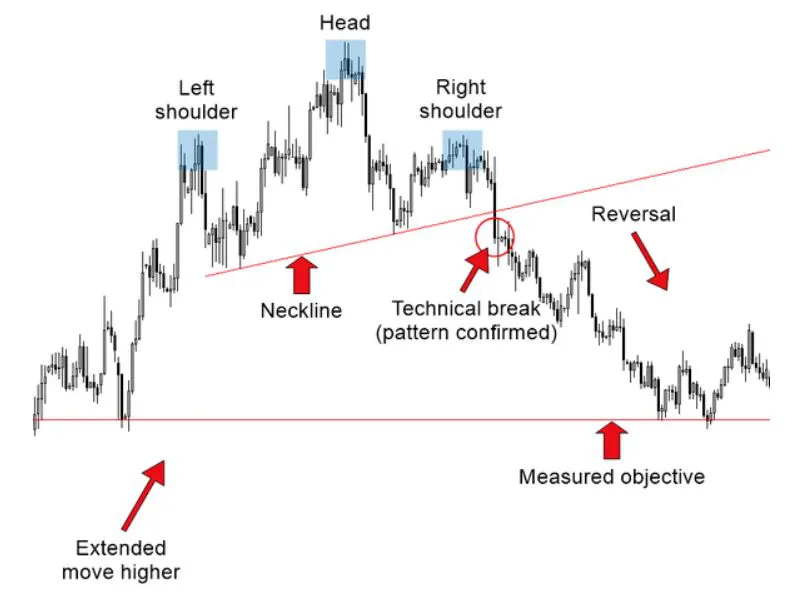
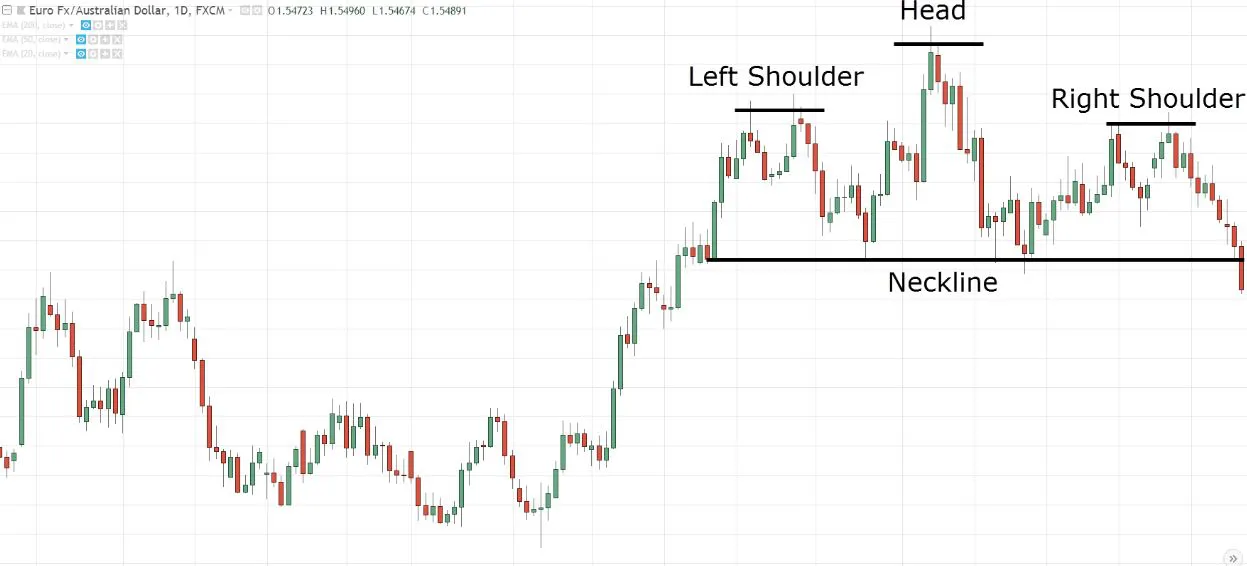
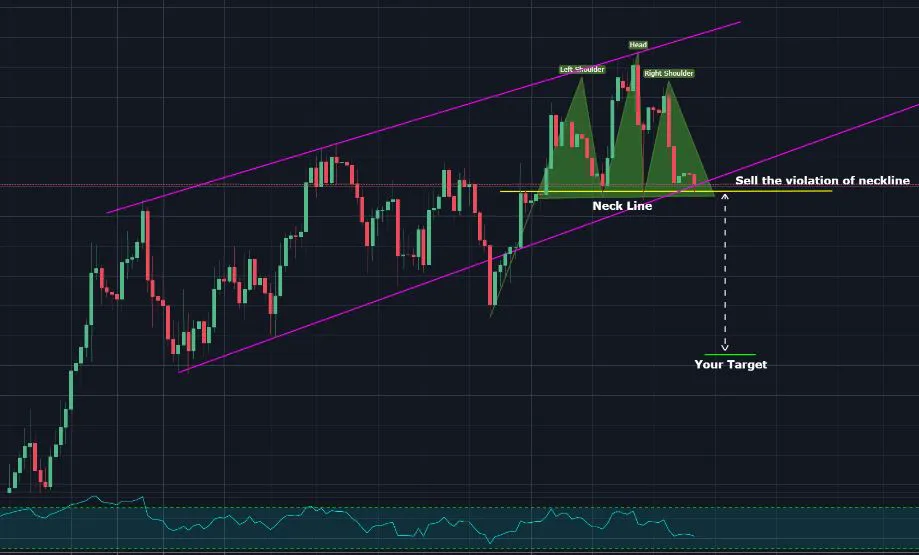
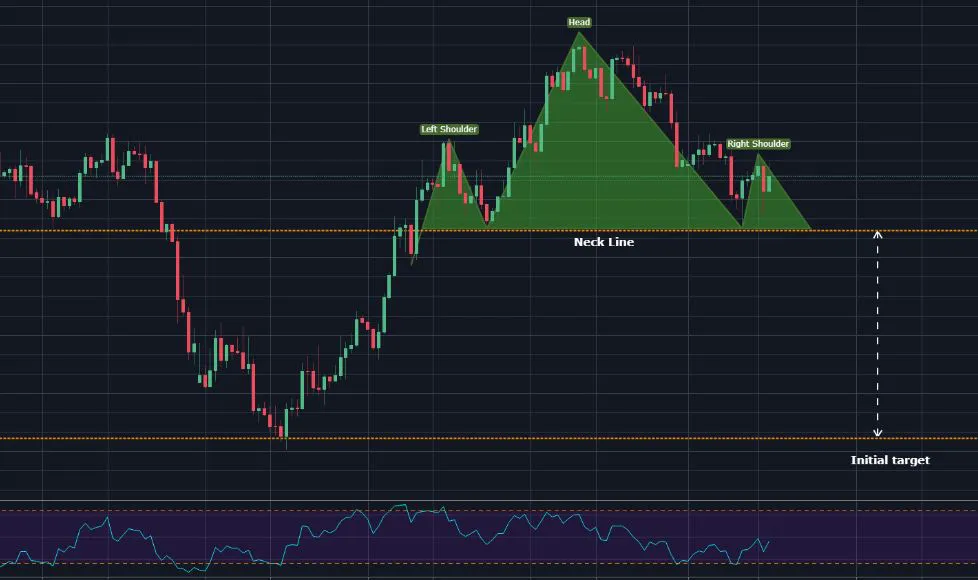
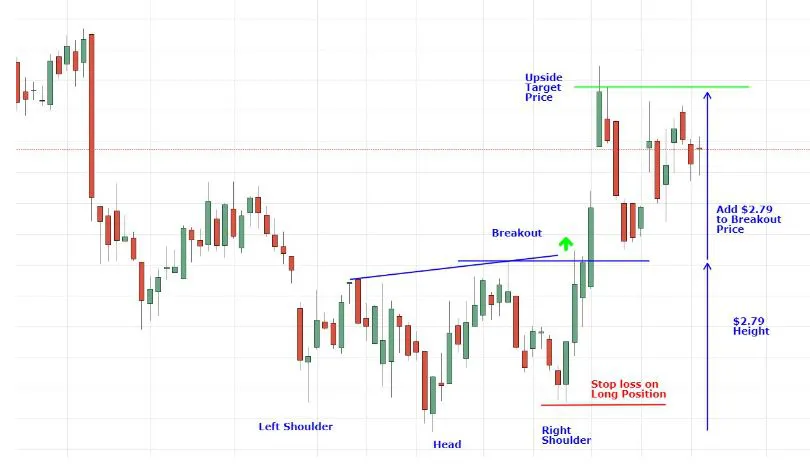
The Head and Shoulders pattern is commonly used to identify potential reversals in the price of an asset. It is formed by three peaks, with the middle peak being the highest, and the two other peaks being slightly lower and of approximately equal height.
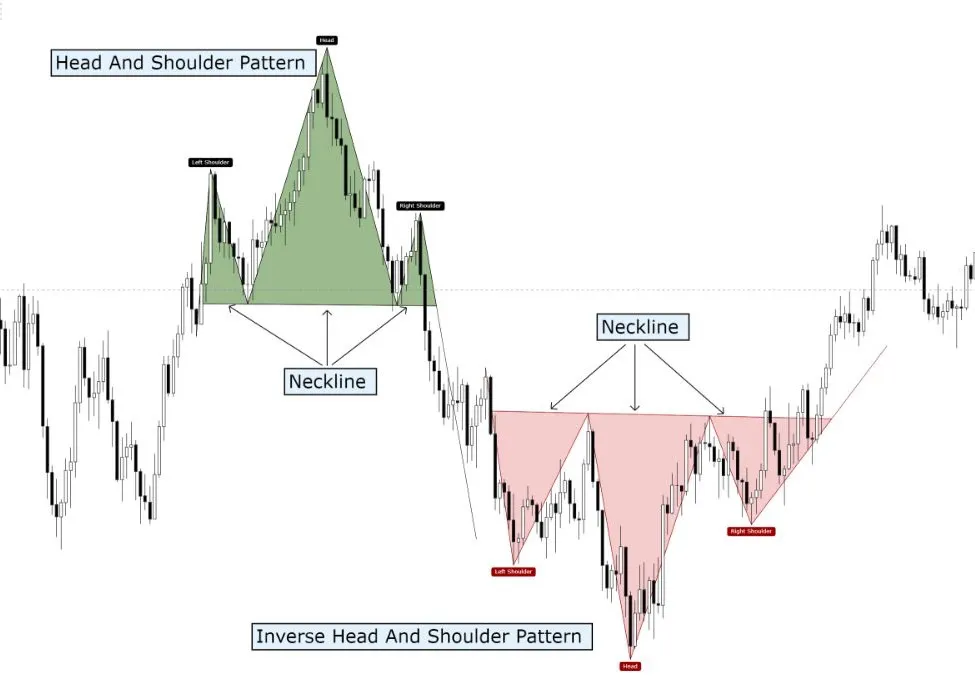
The two lower peaks are called the "Shoulders", while the highest peak is called the "Head".
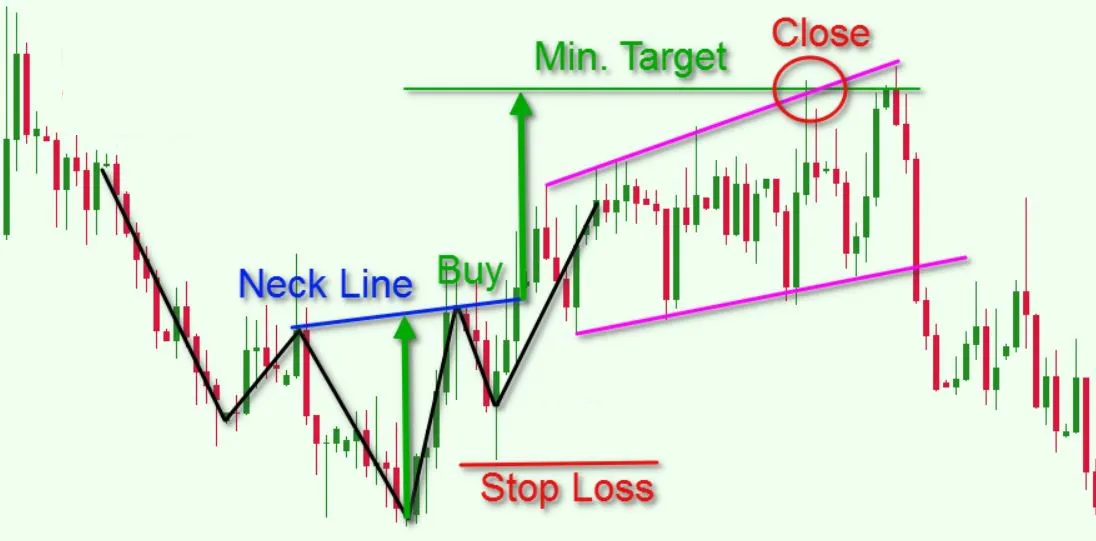
The pattern is completed when the price breaks below the neckline, which is a level of support that connects the two bottoms between the shoulders. This breakout signals a trend reversal.
Horizontal line connecting the low of the left shoulder and the head of the right shoulder, can also get you a support line.