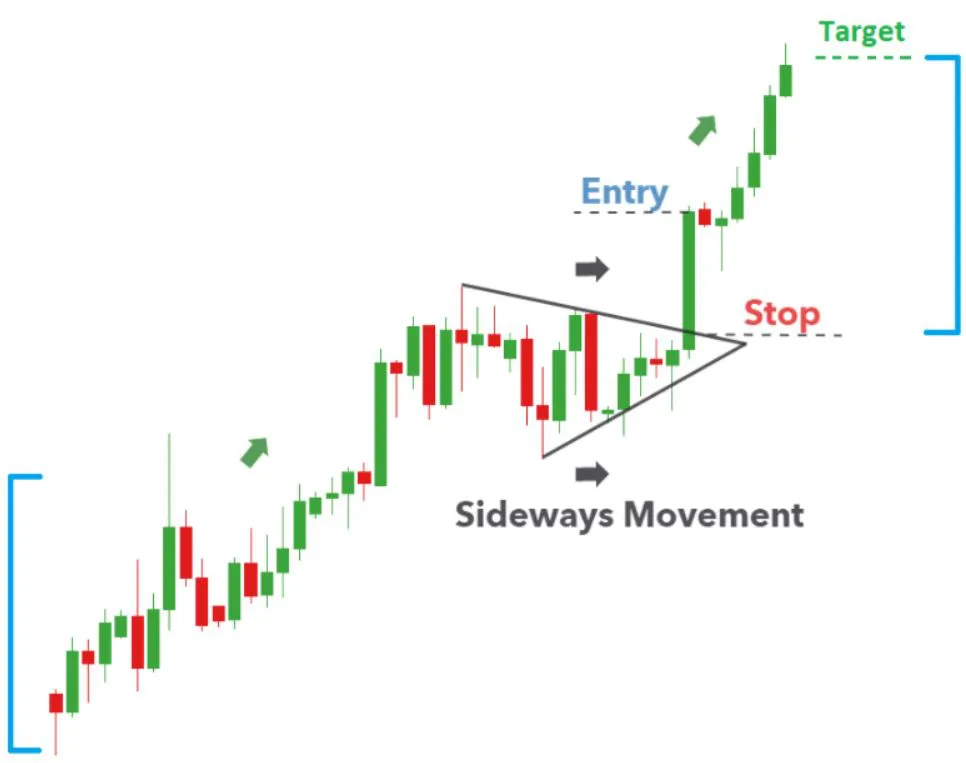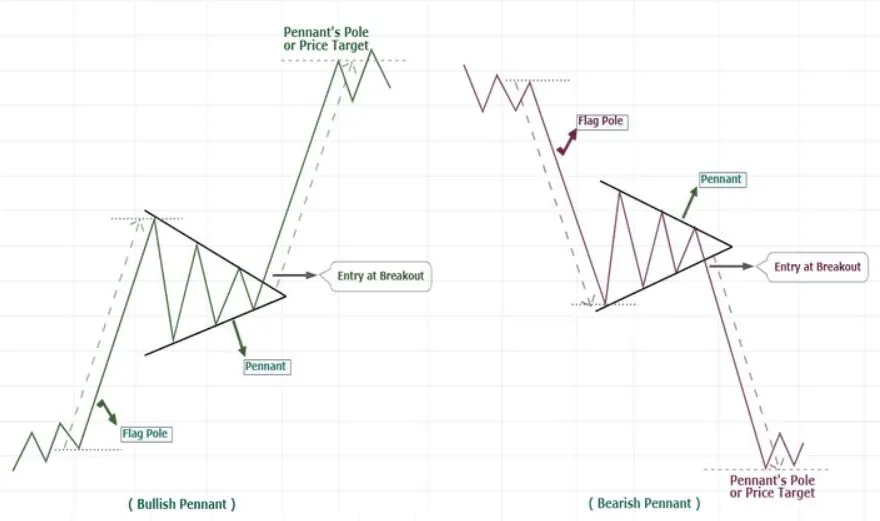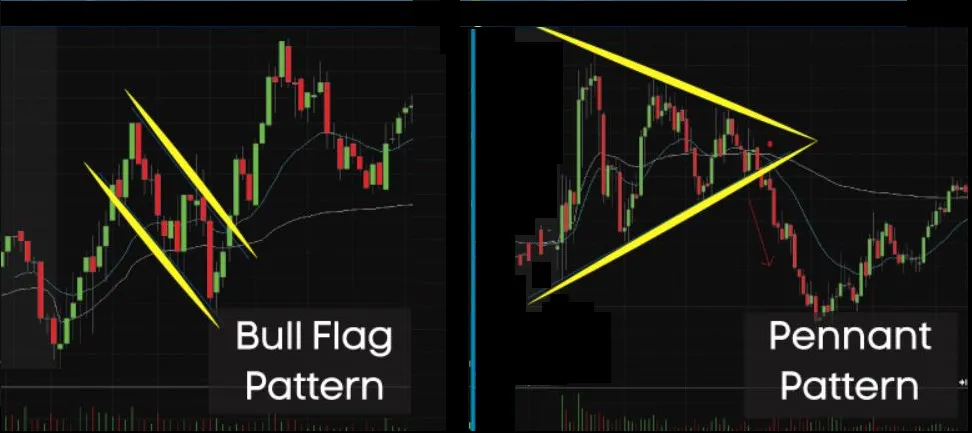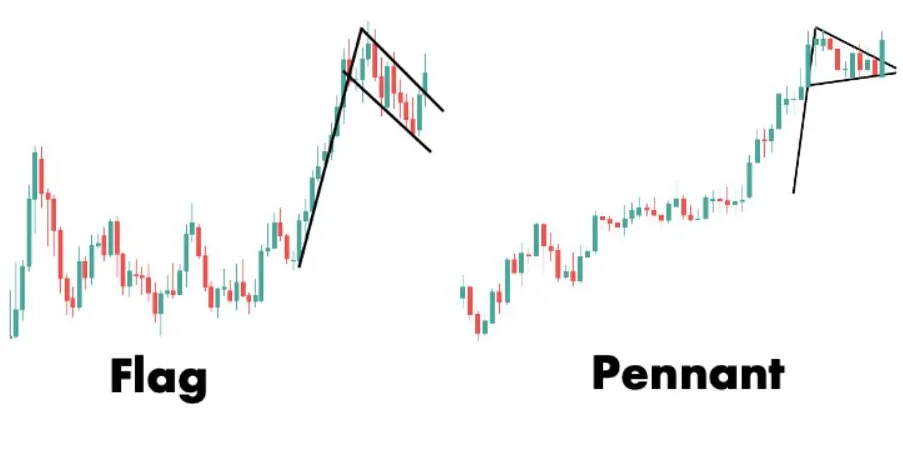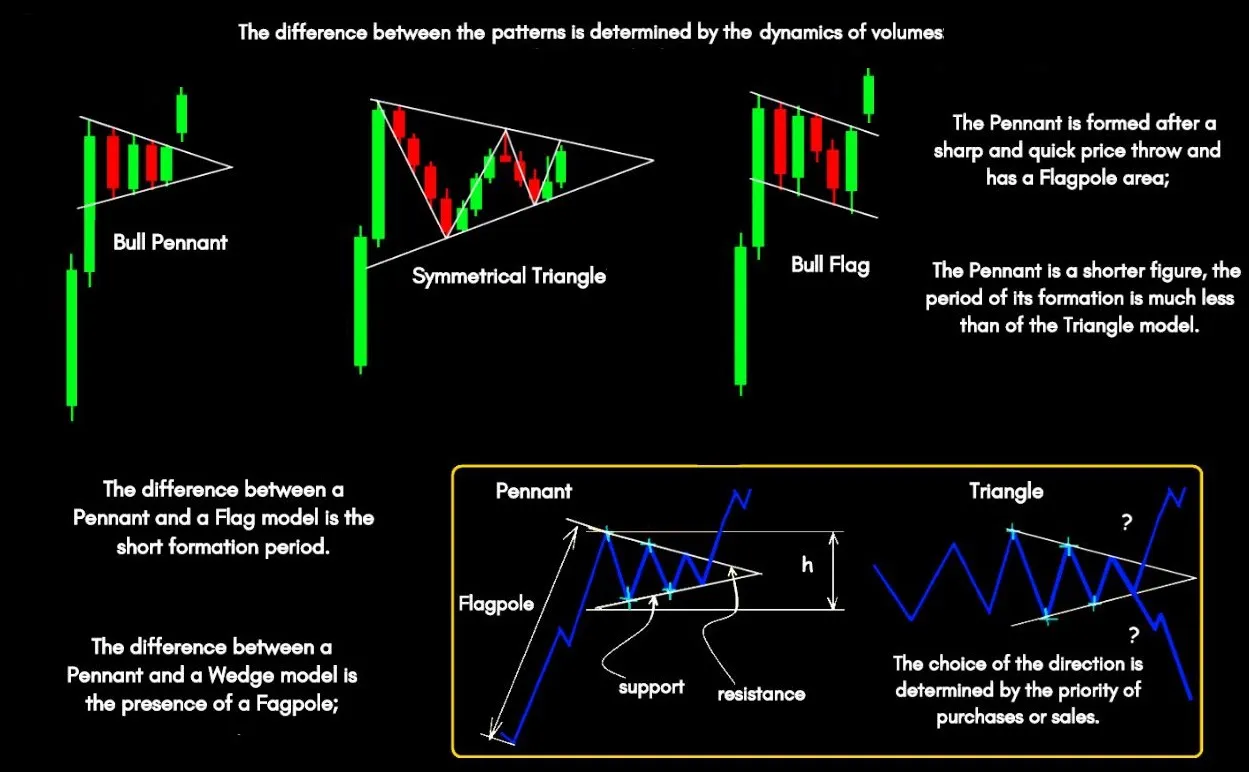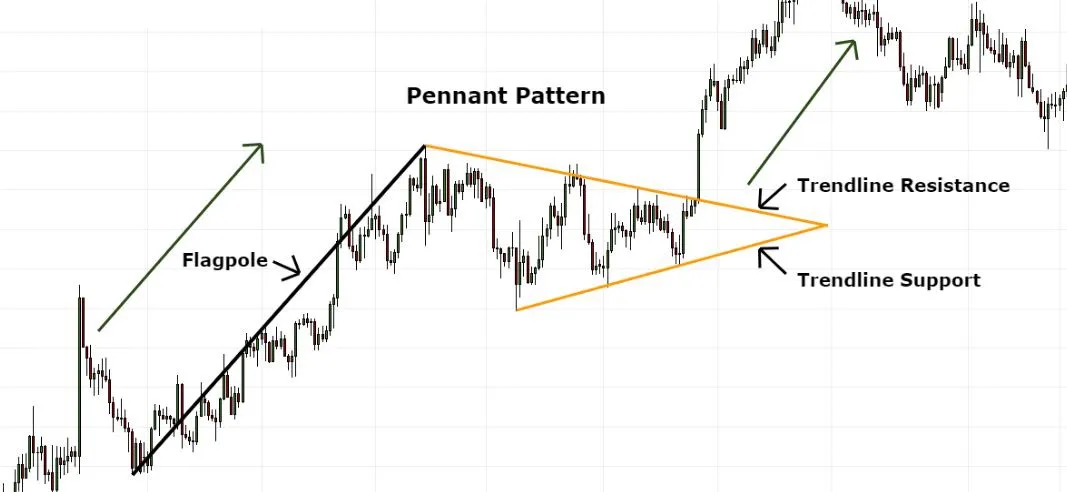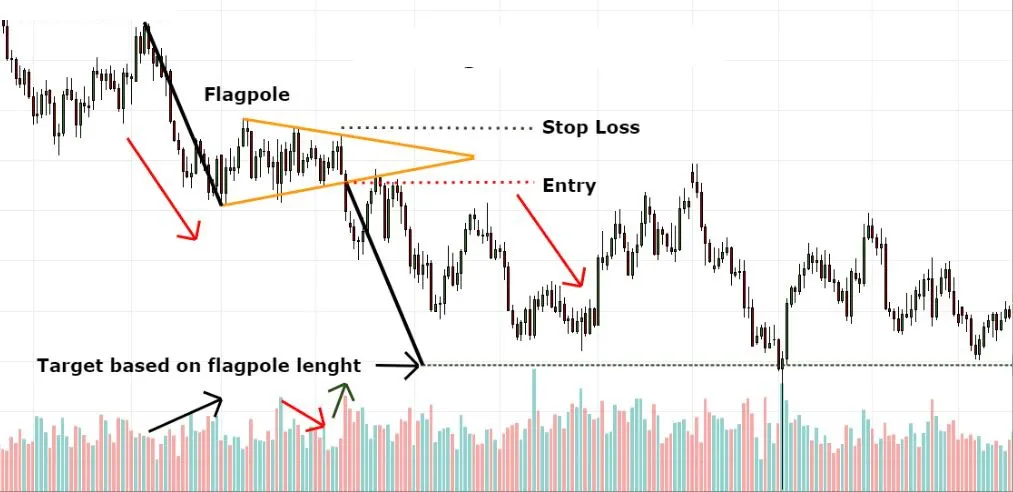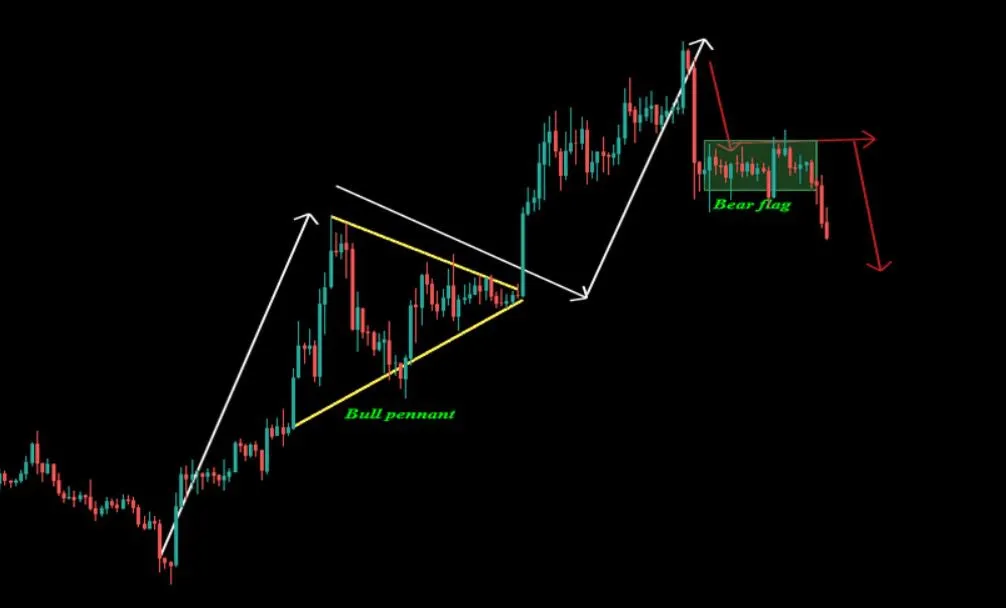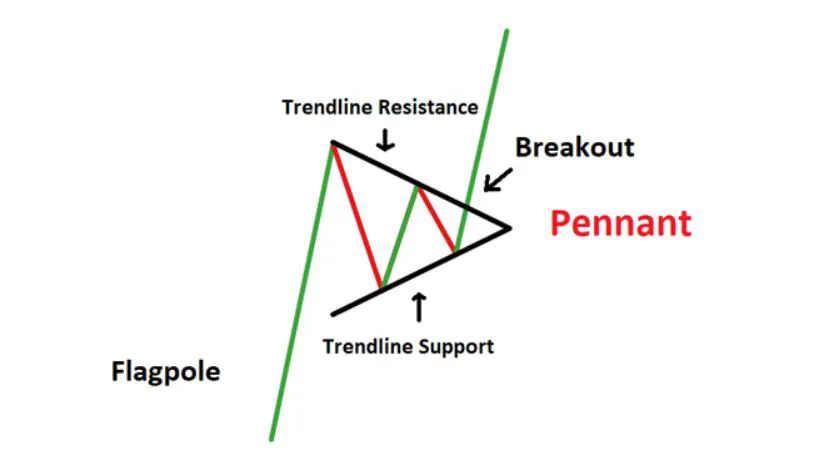
- A Pennant pattern must be preceded by a strong up or down move that resembles a flagpole. If there is no flagpole, it's not a Pennant, but a triangle pattern.
- A Pennant tends to form a shallow retracement, usually less than 38% of the flagpole. A deep retracement indicates a triangle pattern rather than a Pennant.
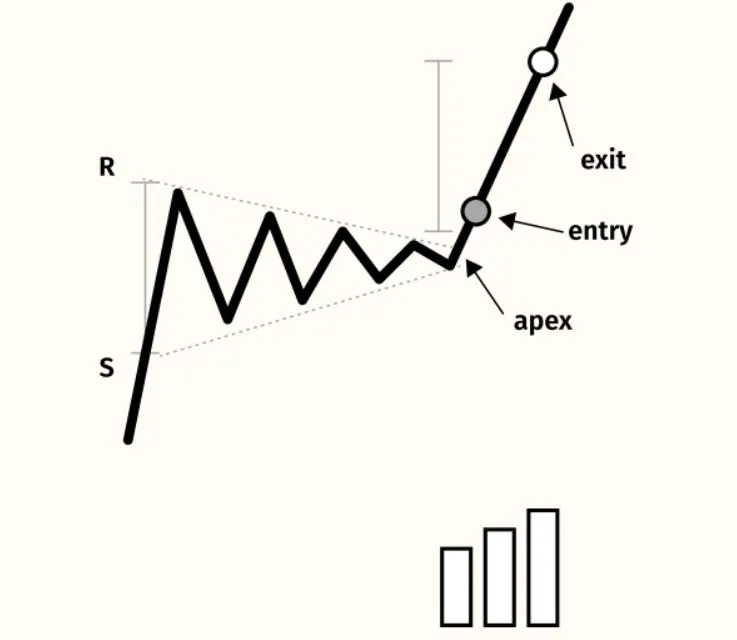
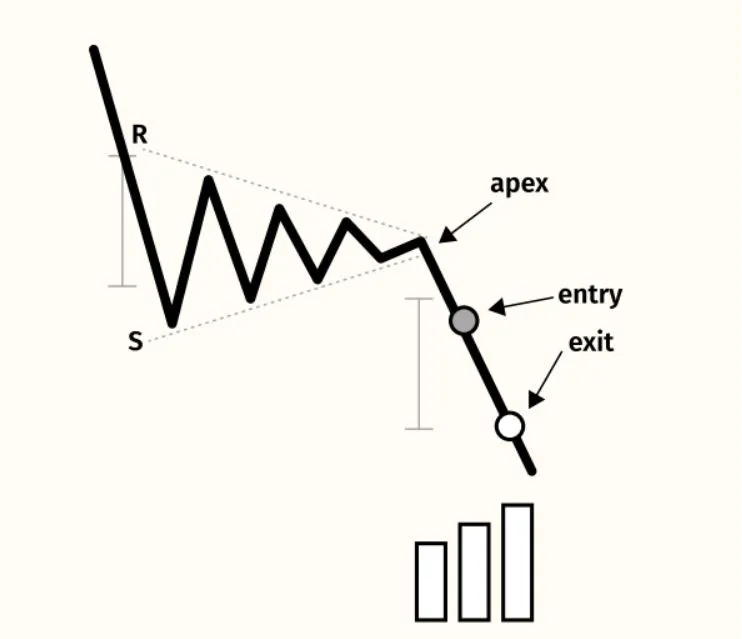
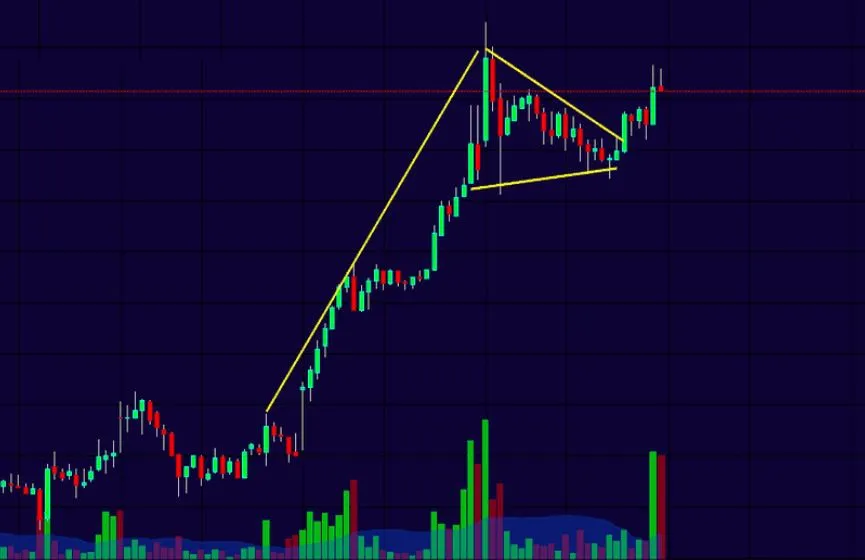
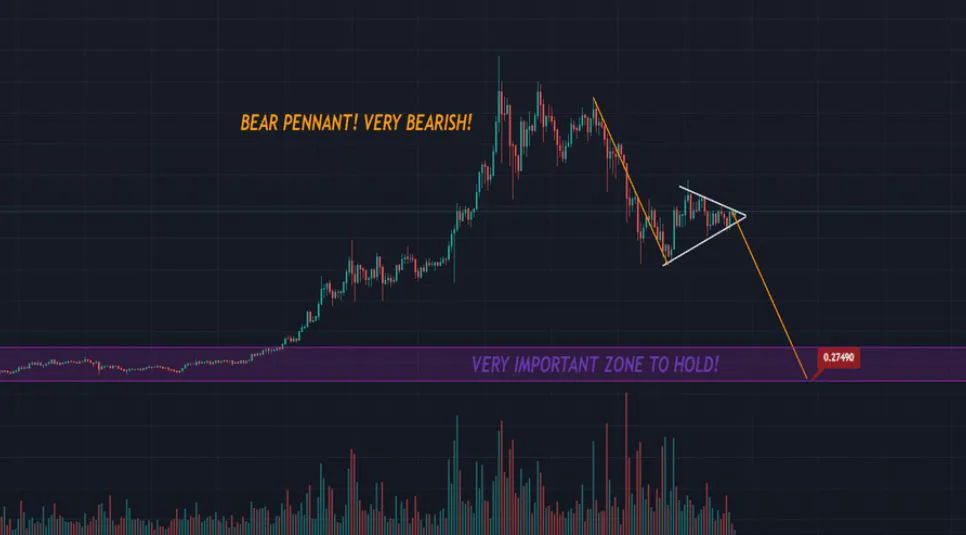
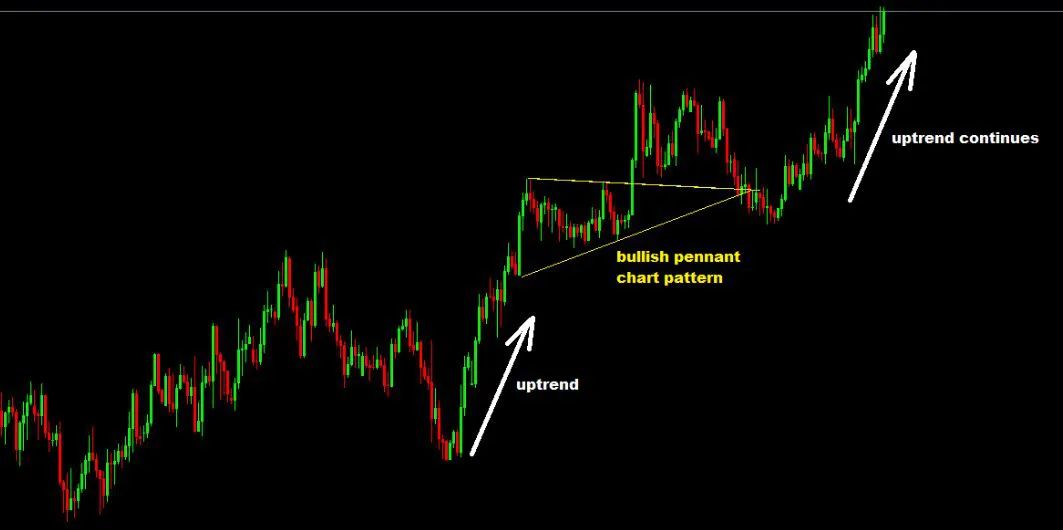
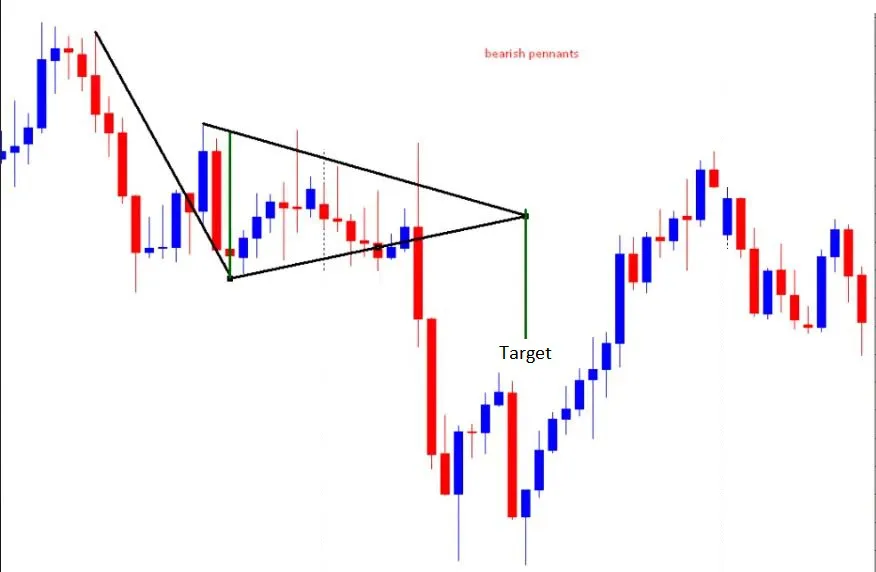
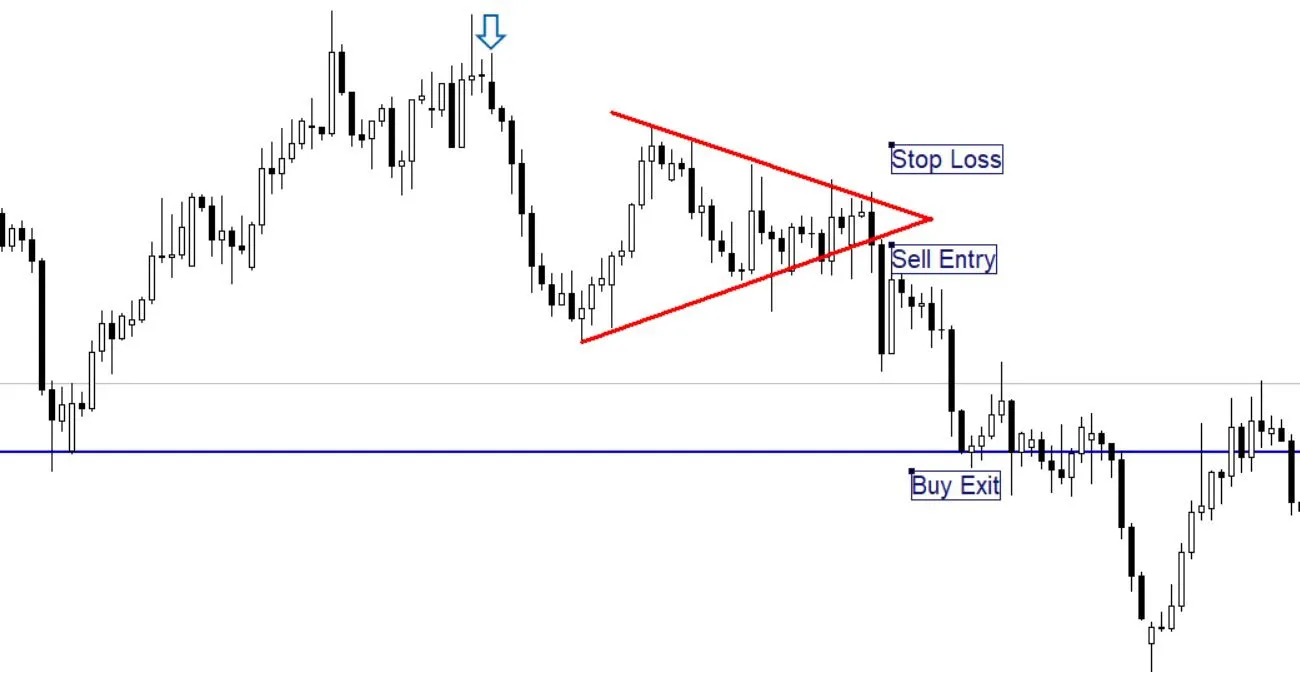
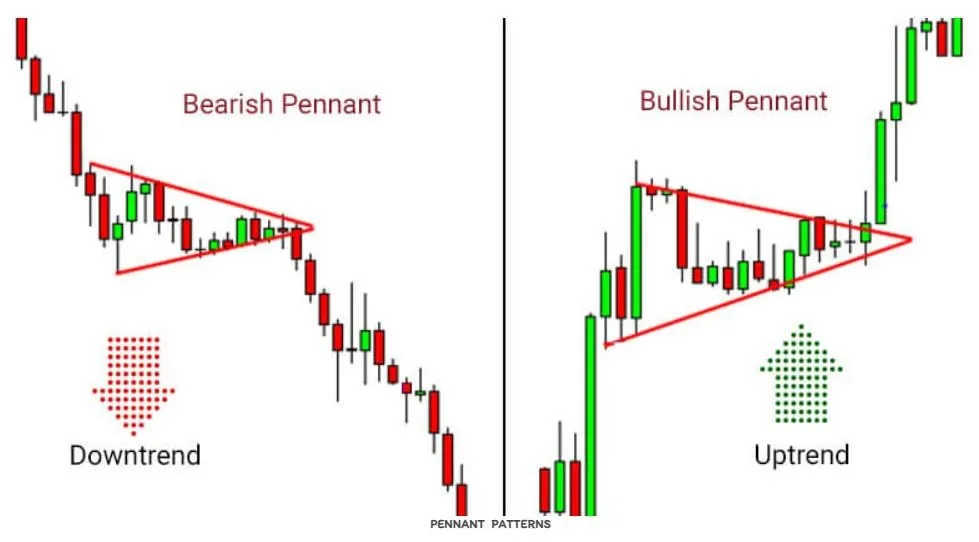
- A Pennant pattern is characterized by the continuation of the upward or downward trend.
- A Pennant pattern is a short-term pattern that is usually completed within 30 to 50 candles. In contrast, a triangle pattern takes much longer to form.
PENNANTS
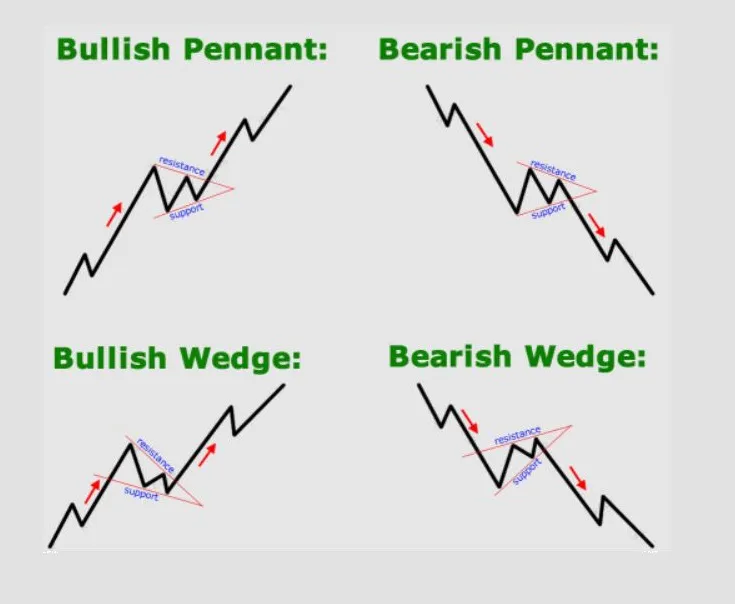
The behavior of Pennant patterns are exactly similar to the Wedge Patterns.
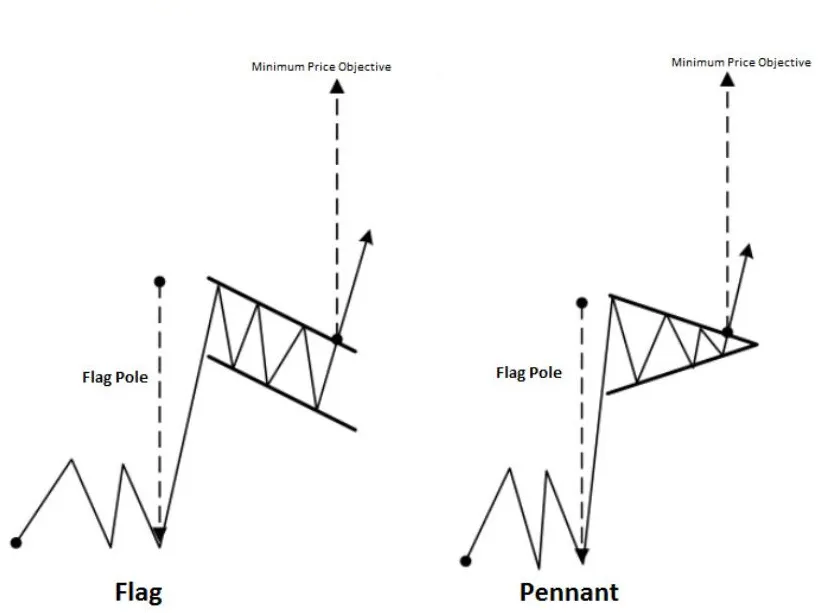
The main difference between Pennant patterns and Wedge patterns is their structure. Pennant patterns are horizontal and sideways, while Wedge patterns are either sloping upwards (ascending wedge) or downwards (descending wedge).
A Pennant pattern is characterized by a small symmetrical triangle that forms after a sharp price move. This pattern can be a continuation pattern depending on the direction of the preceding trend.