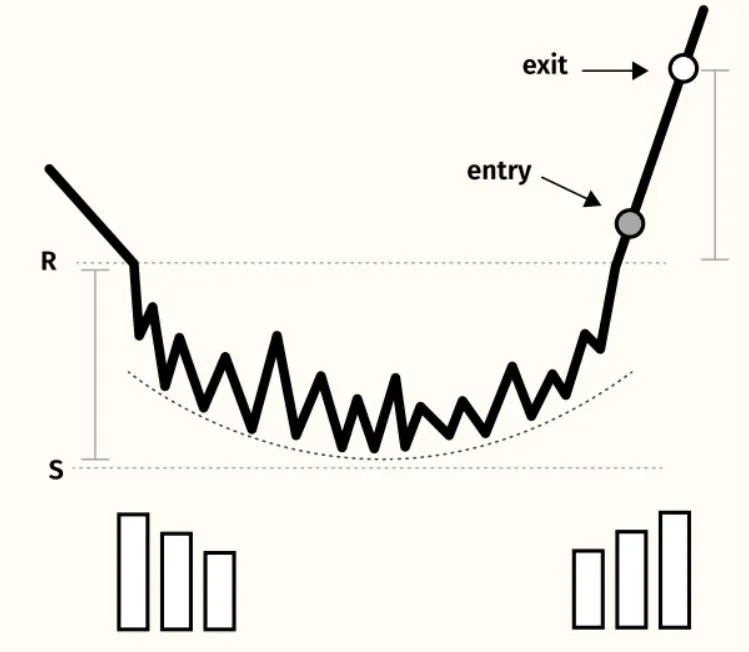
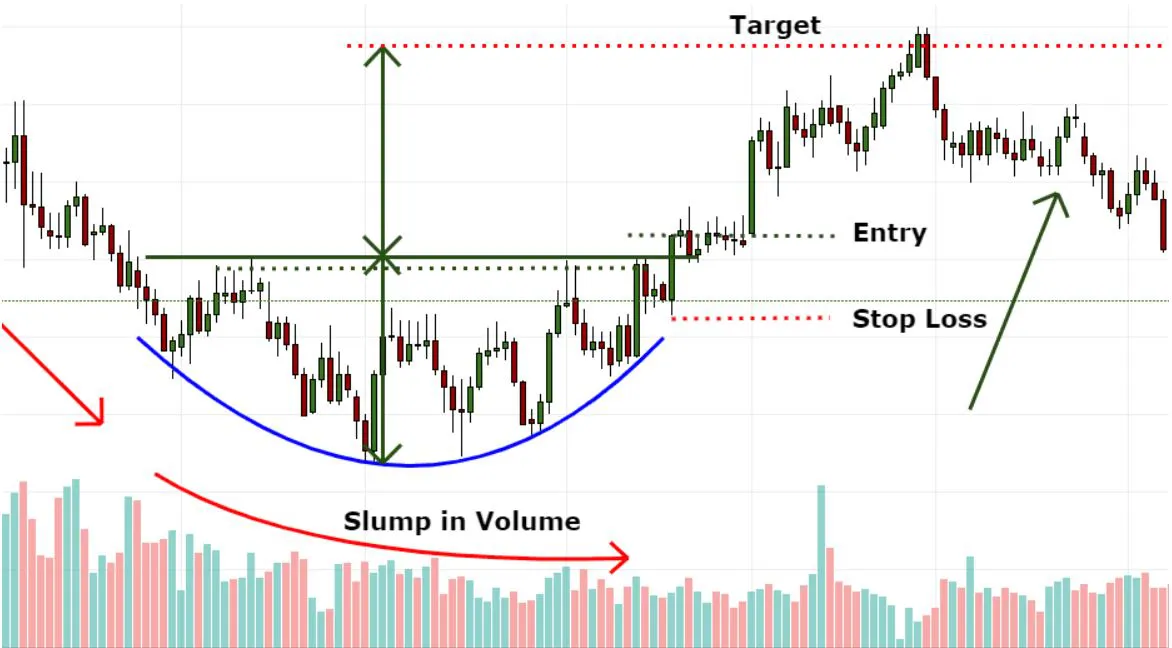
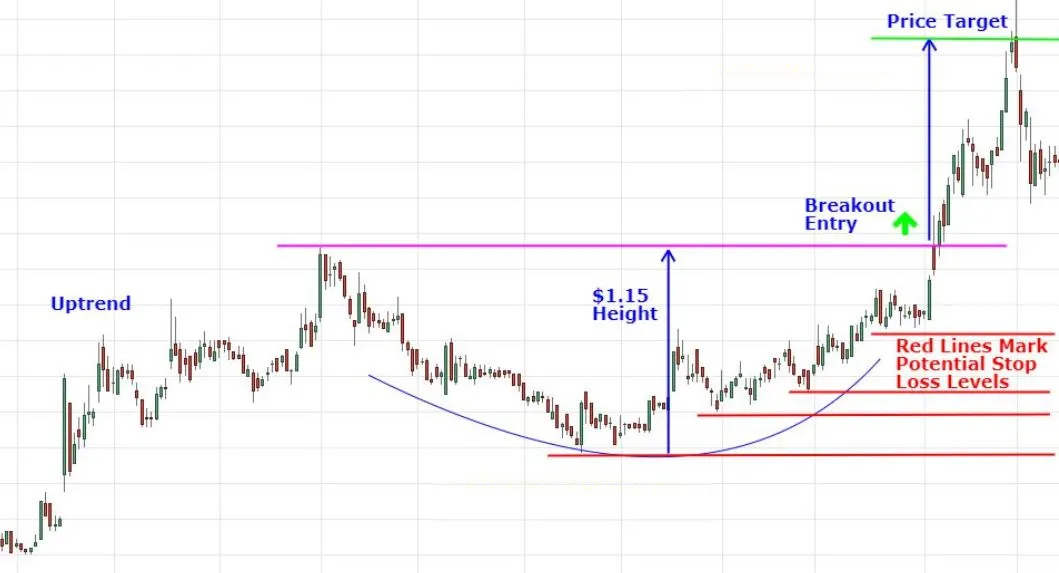
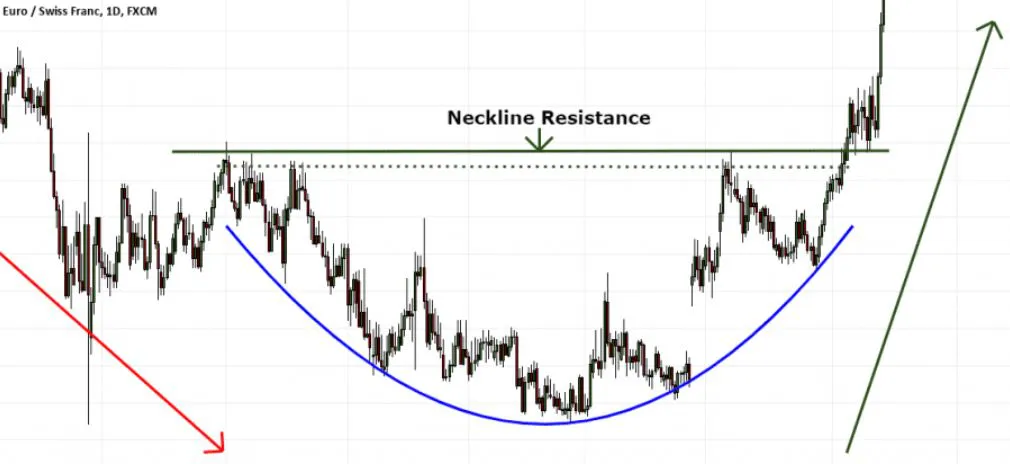
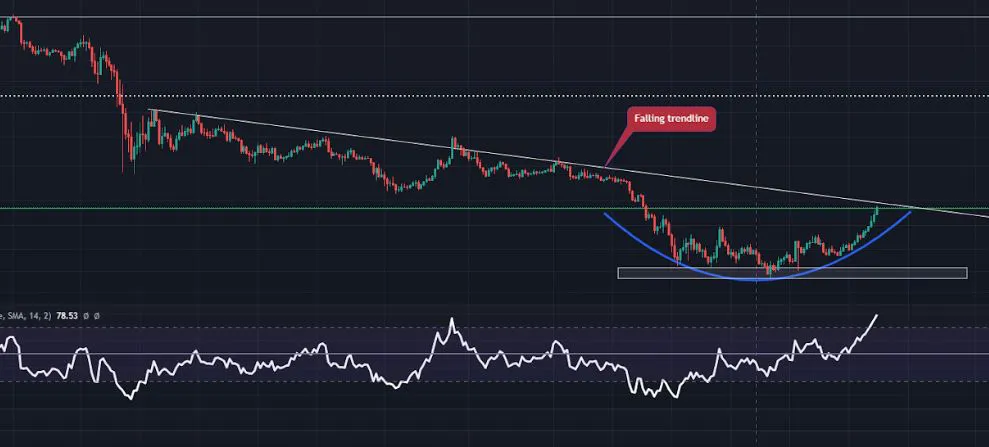
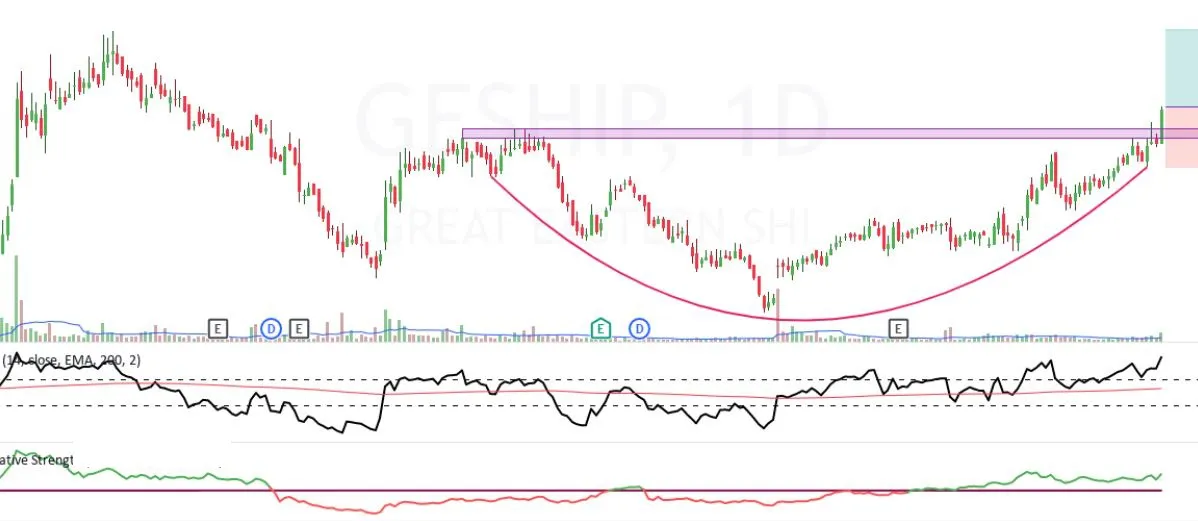
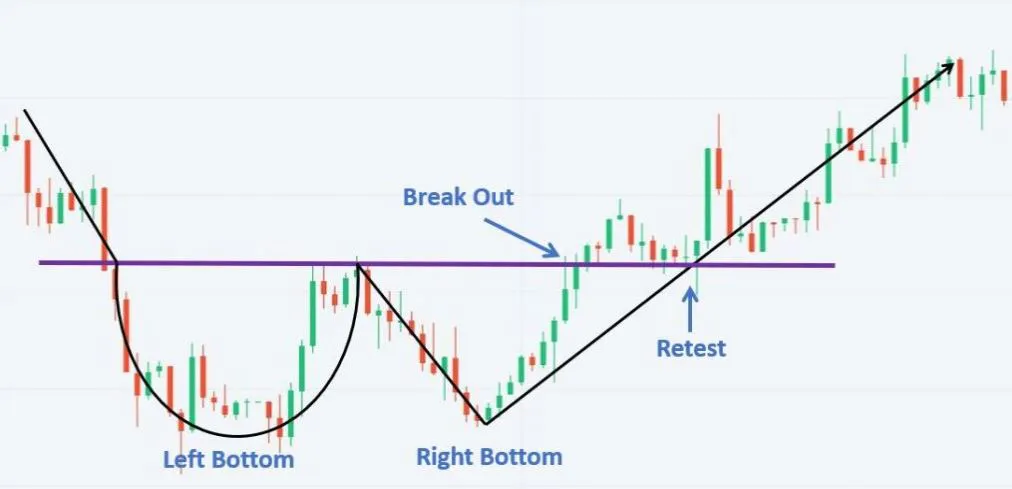
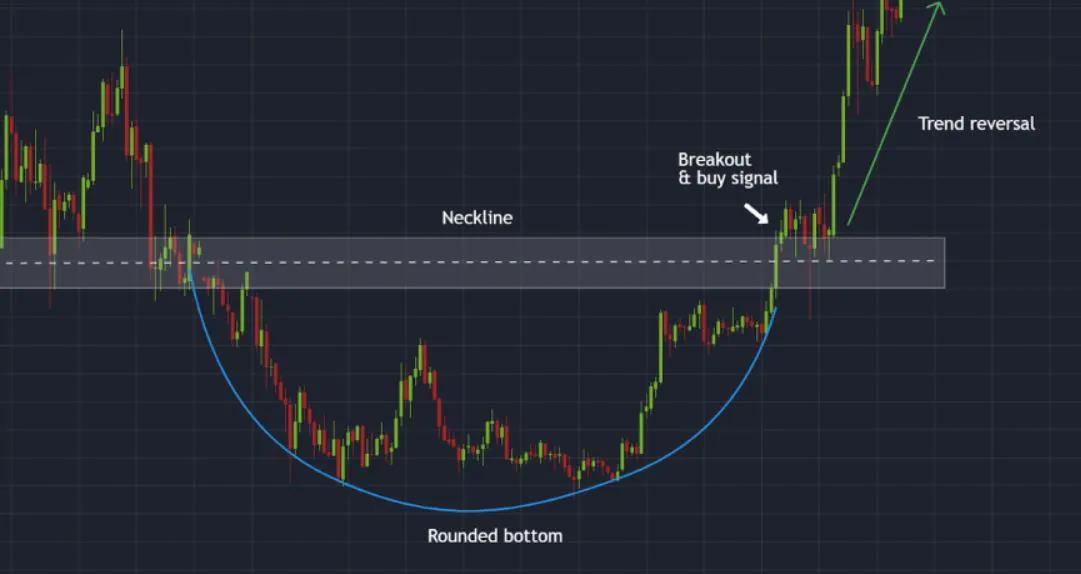
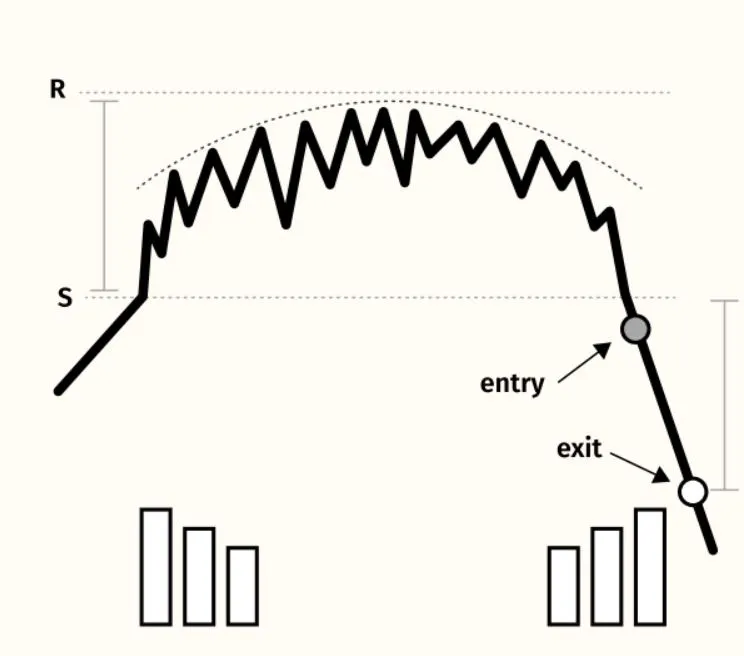
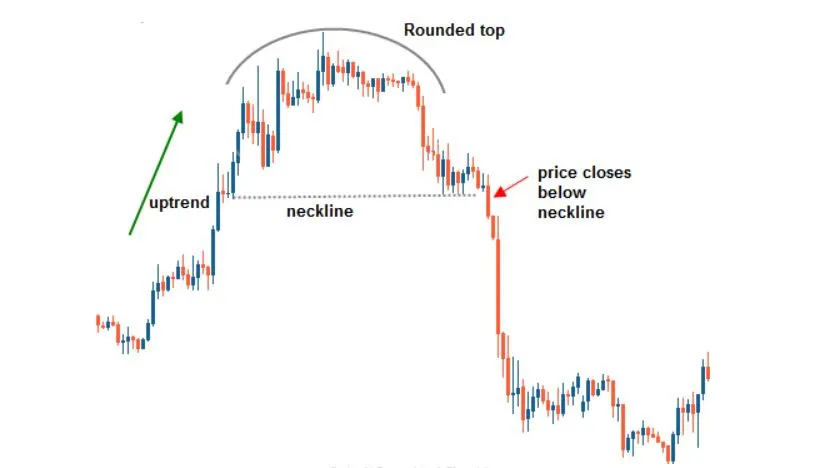
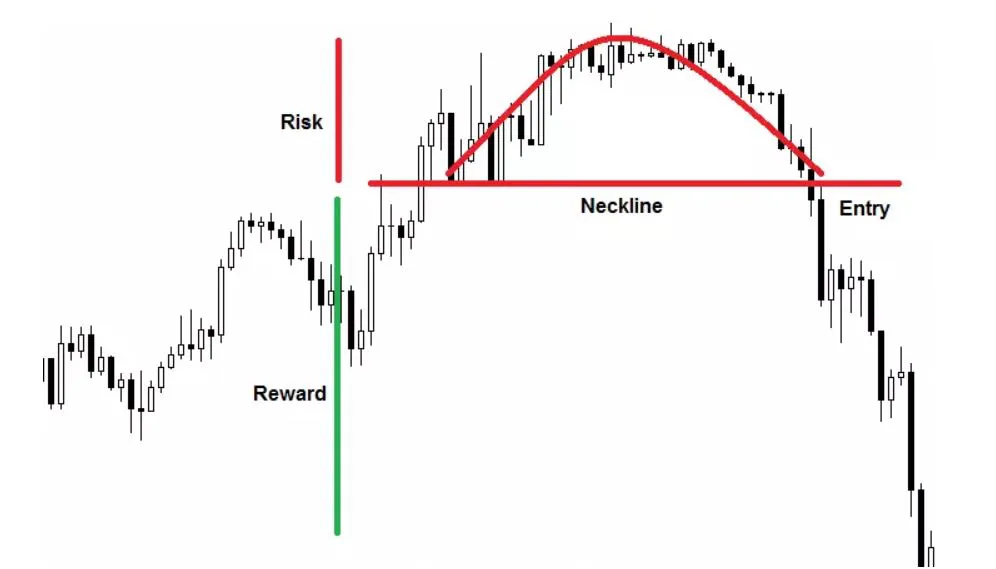
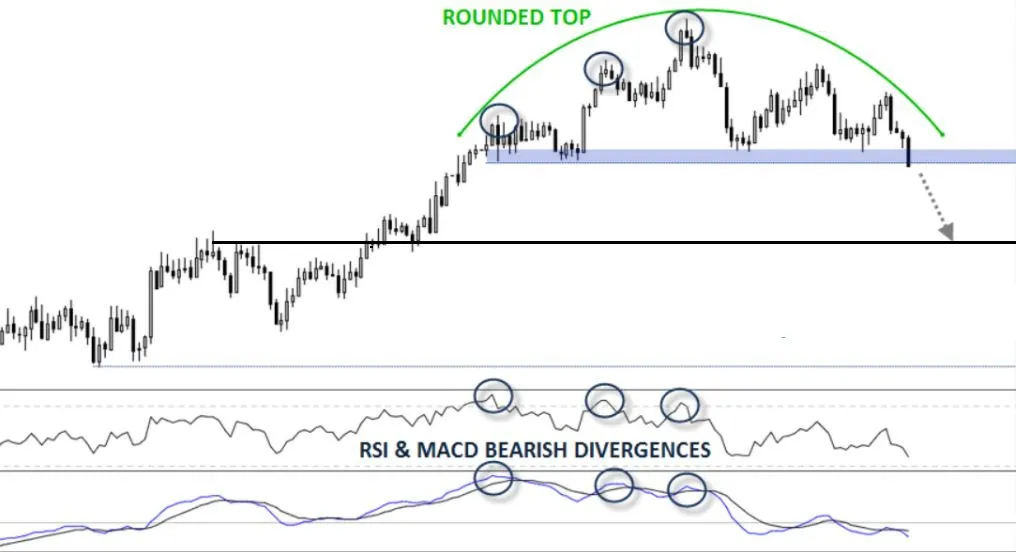
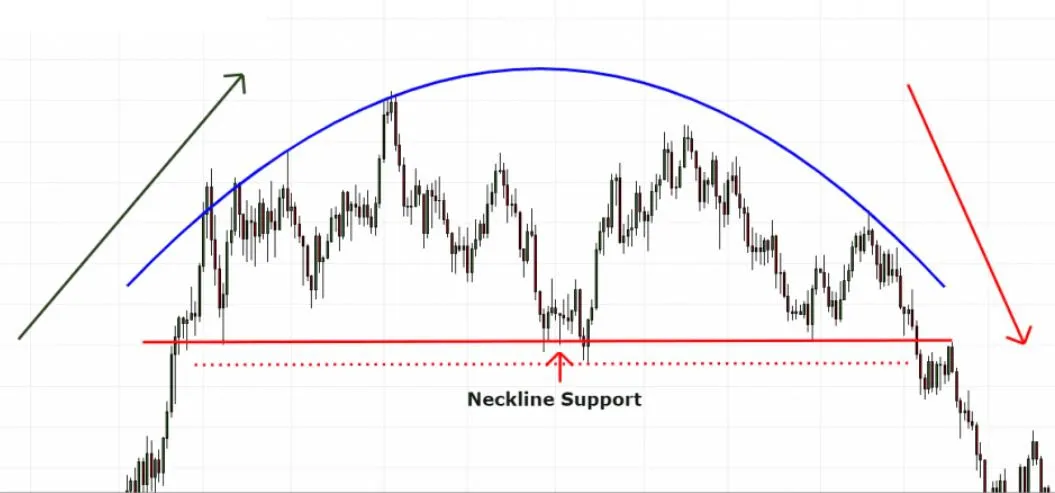
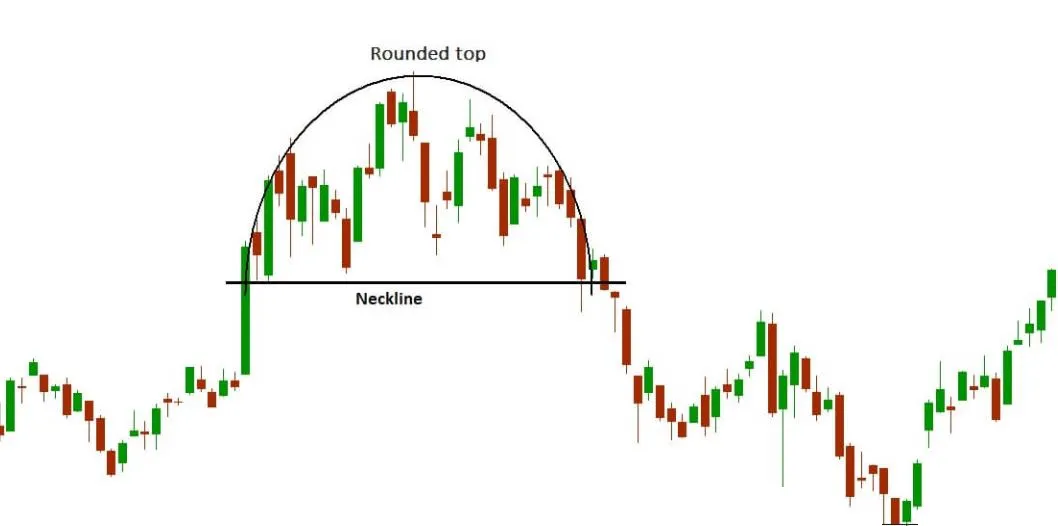
ROUNDED PATTERN

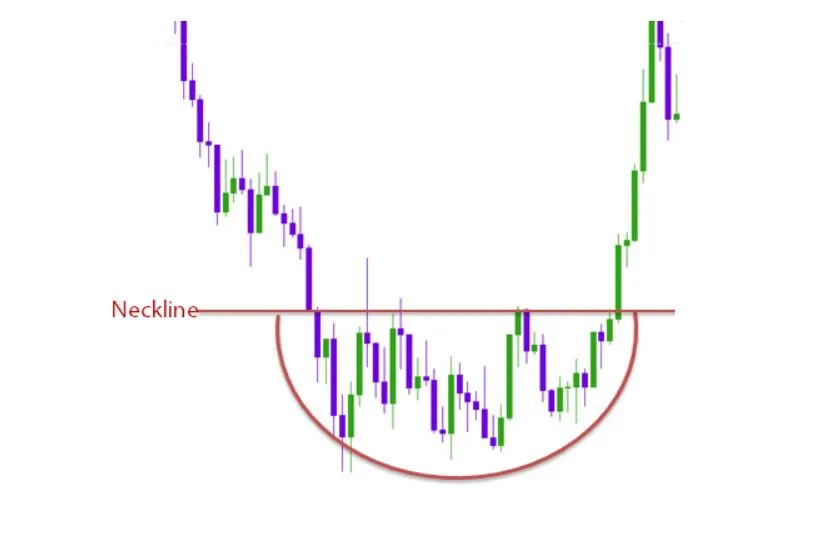
Rounded pattern is a technical analysis pattern that appears on price charts and indicates a potential trend reversal. It is also known as a "saucer" pattern and is characterized by a gradual, curved bottom in the price chart.

Traders and analysts use the rounded pattern to identify potential buying/selling opportunities, as it suggests that the current trend has ended and a new trend is beginning.

Types in Rounded pattern:
  1. Rounded Bottom

    • This is the most common type of Rounded Pattern.
    • It is characterized by a gradual, rounded bottom in the price chart, which indicates a potential trend reversal from a downtrend to an uptrend.
    • The pattern is complete when the price breaks out above the resistance level, which is usually located near the highest point of the curve.
  2. Rounded Top

    • This is the opposite of the Rounded Bottom Pattern.
    • It is characterized by a gradual, rounded top in the price chart, which indicates a potential trend reversal from an uptrend to a downtrend.
    • The pattern is complete when the price breaks down below the support level, which is usually located near the lowest point of the curve.

How to take position in the market?
- Depending on trading psychology and individual risk, some Traders follow below rules to enter into positions.

  1. Entry

    • Identify the Rounded Bottom/Top on price chart
    • Draw a horizontal line (Neck Line) across the top of the bearish and bullish sides of the rounding bottom/top pattern.
    • Wait for the close price to cross the Neck Line in a reversal direction with large candle and increased volume.
    • Confirm the pattern with volume indicators and take a Position
  2. Target

    • Measure the distance between the Neck Line and the lowest/highest point of the Rounded Pattern.
    • Apply the same distance to the downside/upside starting from the Neck Line, respectively.
    • This gives you an estimate of how far the price may go after breaking out of the pattern.
    • This distance represents your minimum target profit level for the trade.
  3. Stop Loss

    • Stop loss level should be slightly above/below of the neck line in the pattern respectively

Rounded Pattern vs Cup and Handle pattern


  • Rounded Pattern is a bullish reversal pattern.
  • Cup and Handle pattern is a bullish continuation pattern.
  • A Rounded Pattern is a curved bottom on a price chart that signals a potential trend reversal. It looks similar to the Cup and Handle pattern, but without the temporary downward or upward trend of the "handle" portion.
  • In contrast, the Cup and Handle pattern is a continuation pattern that signals the resumption of an existing trend.
  • Example-1 : Formation of Rounded Top Pattern


    Example- : Rounded Top Pattern with Risk and Reward target


    Example- : Rounded Bottom Pattern with Entry, Target and Stop-Loss


    Example- : Perfect Rounded Bottom Pattern


    Example- : Rounded Bottom Pattern with RSI


    Example- : Formation of Long Term Rounded Bottom pattern


    Example- : Very rare type of Rounded Bottom Pattern


    Example- : Rounded Top Pattern with MACD and RSI divergence


    Example- : Rounded Top Pattern


    Example- : Rounded Top Pattern


    Example- : Its Not Rounded Bottom Pattern, Its a Cup and Handle Pattern


    Example- : Rounded Bottom Pattern


    Share the App - Share Alpha