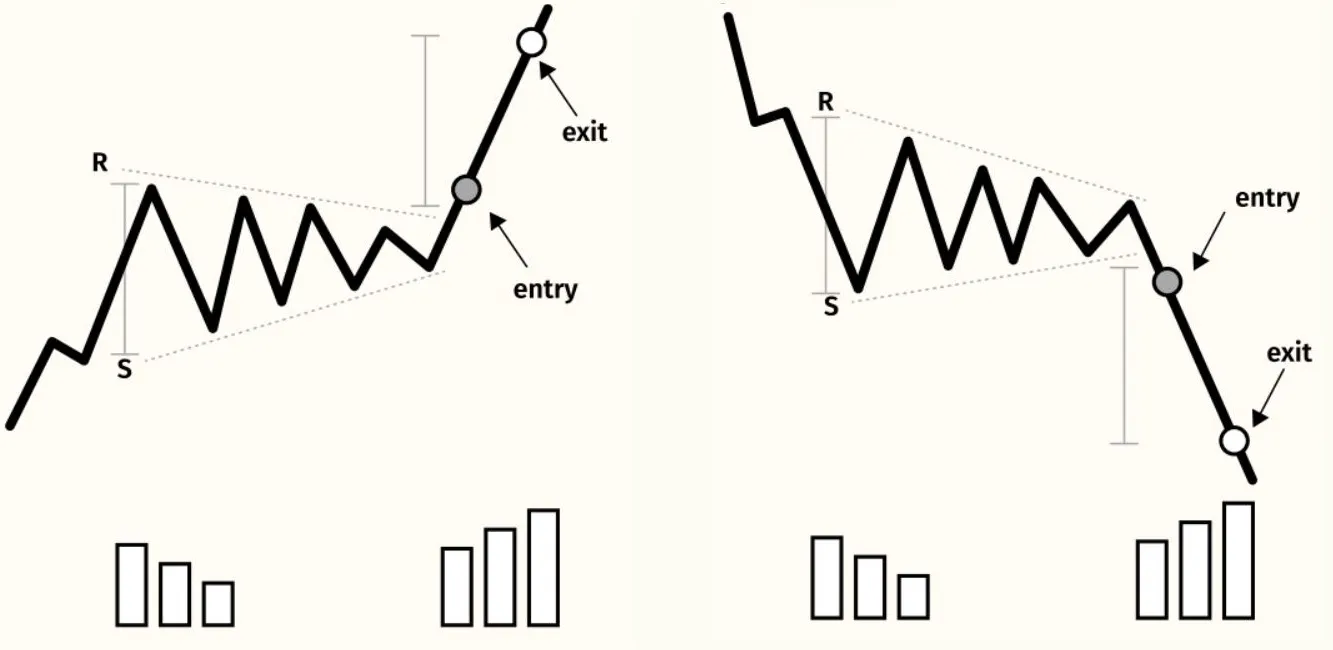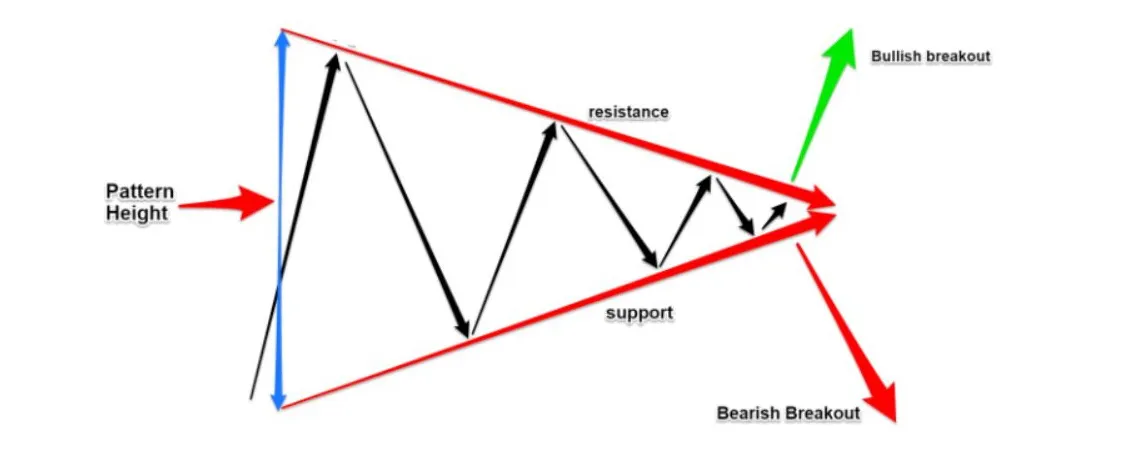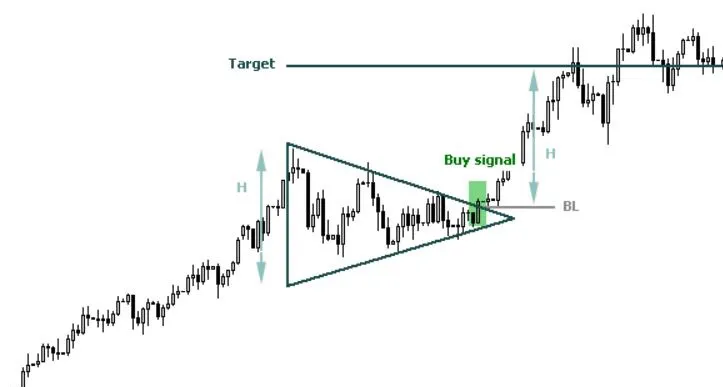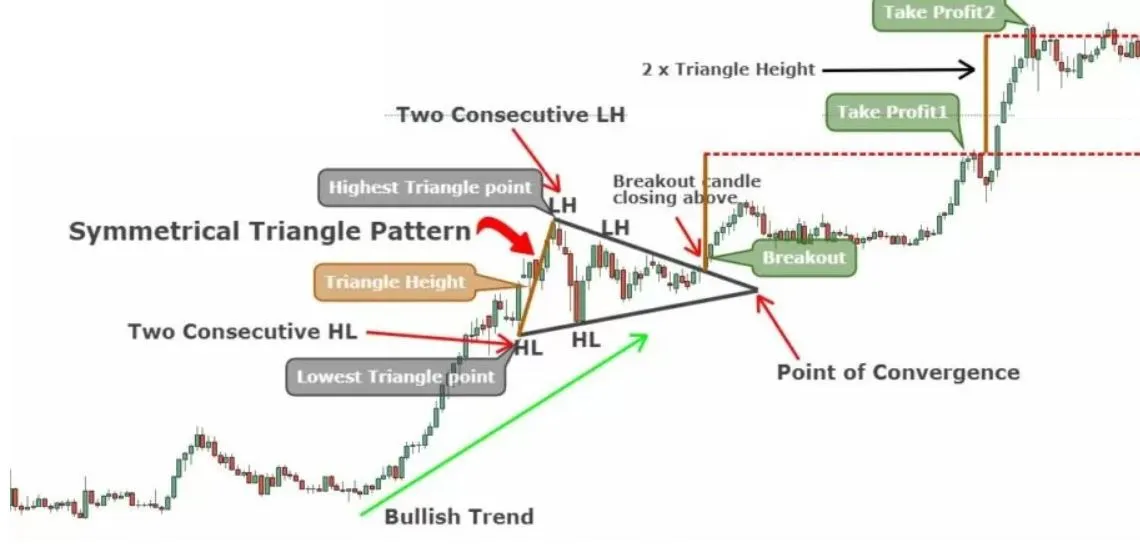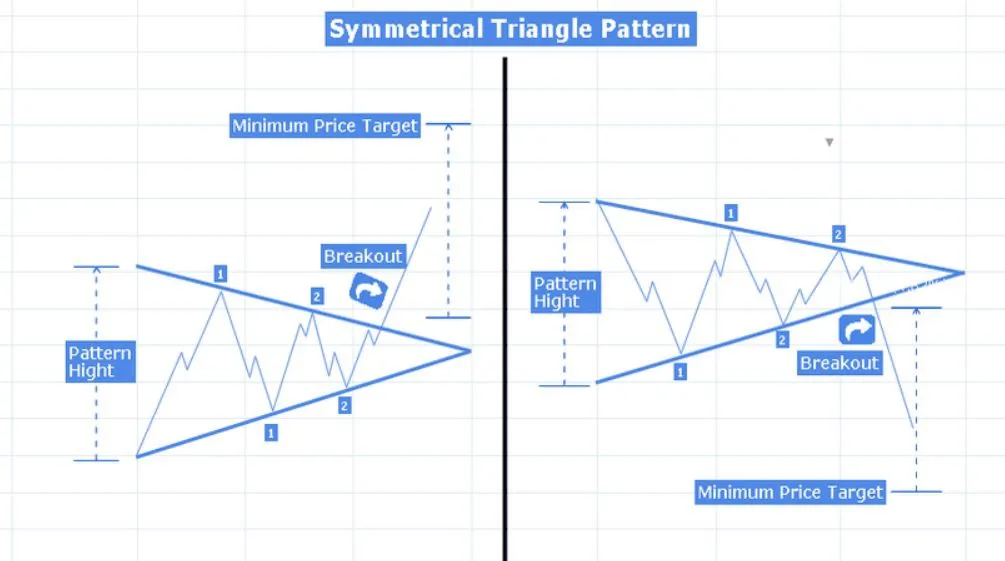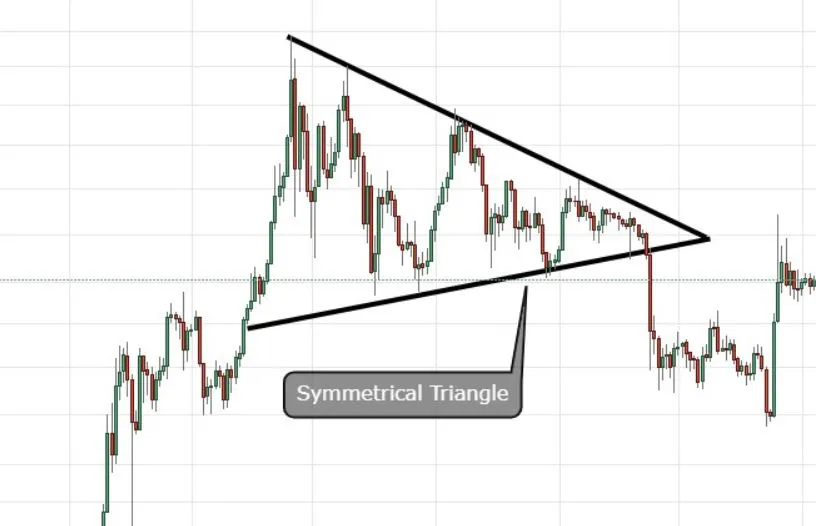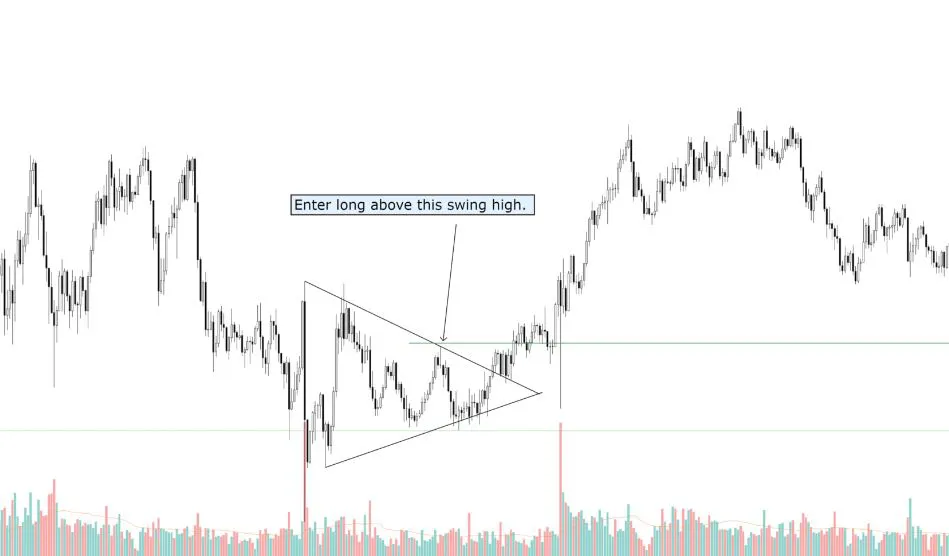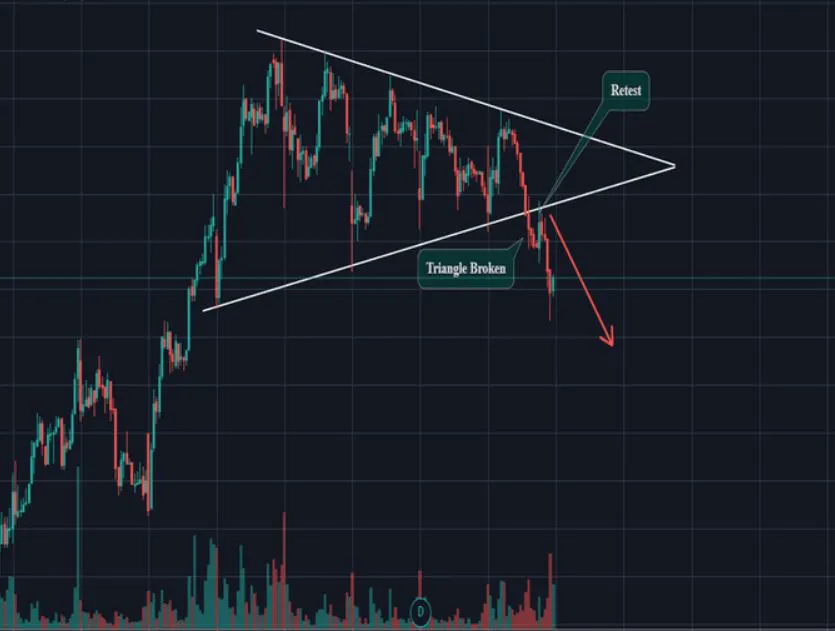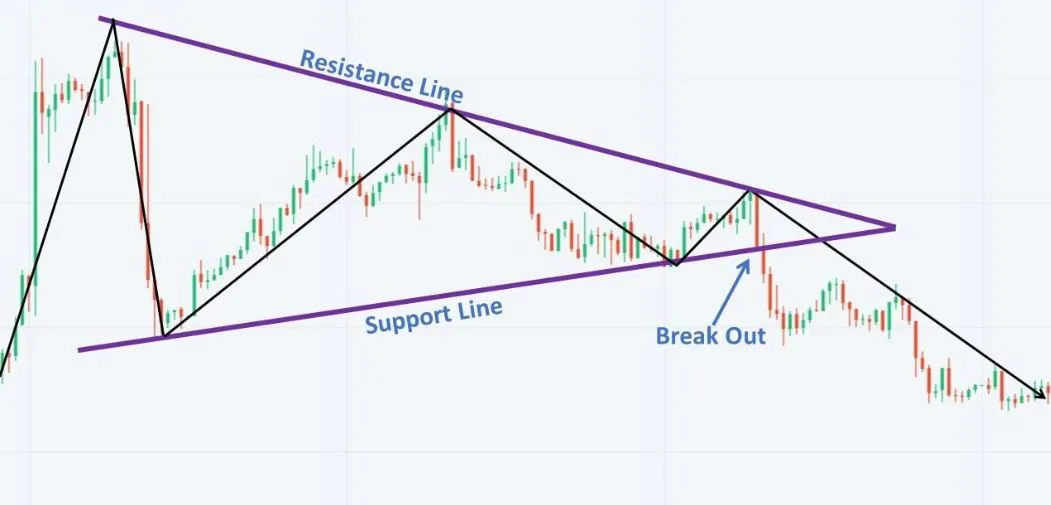
- Symmetrical triangle pattern
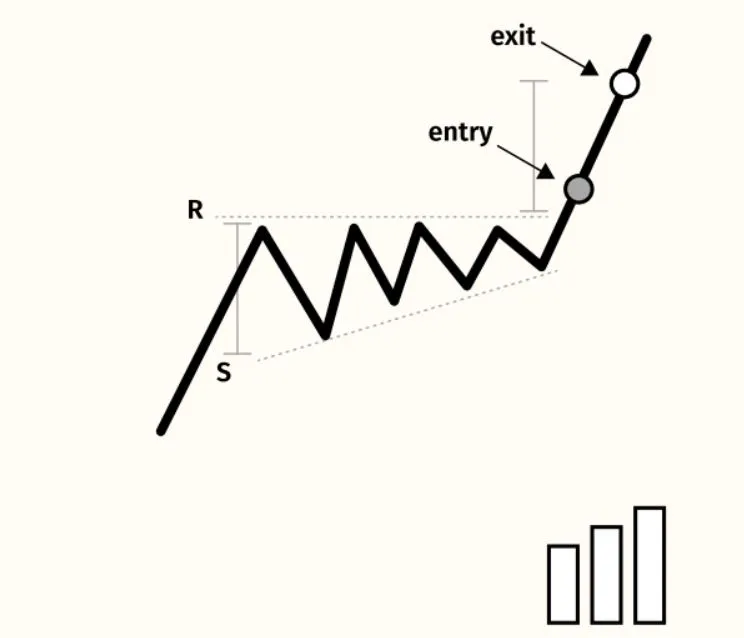
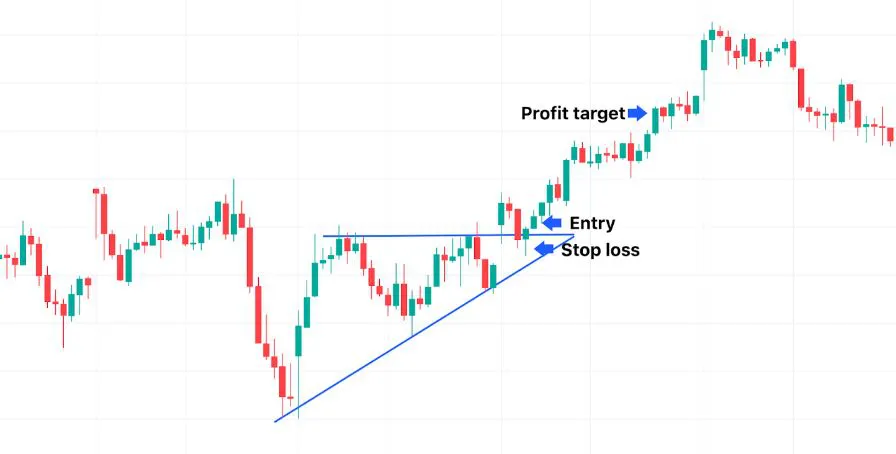
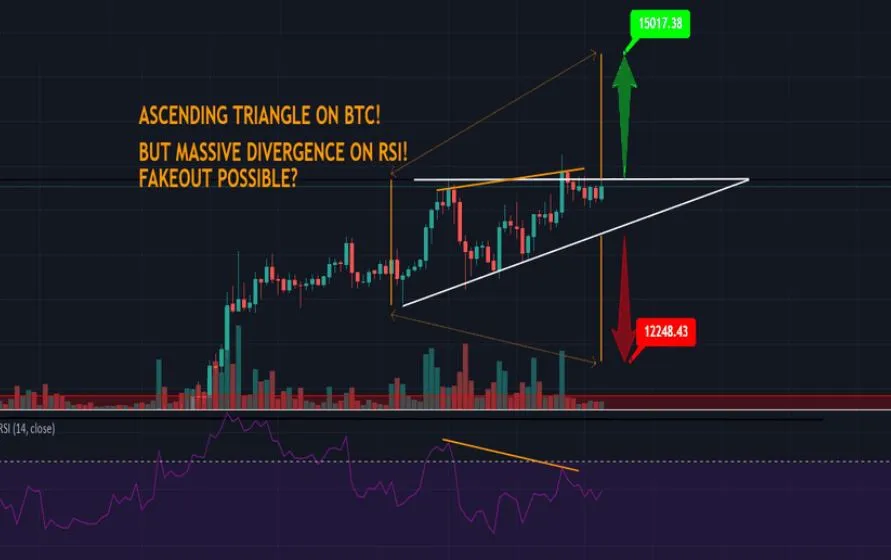
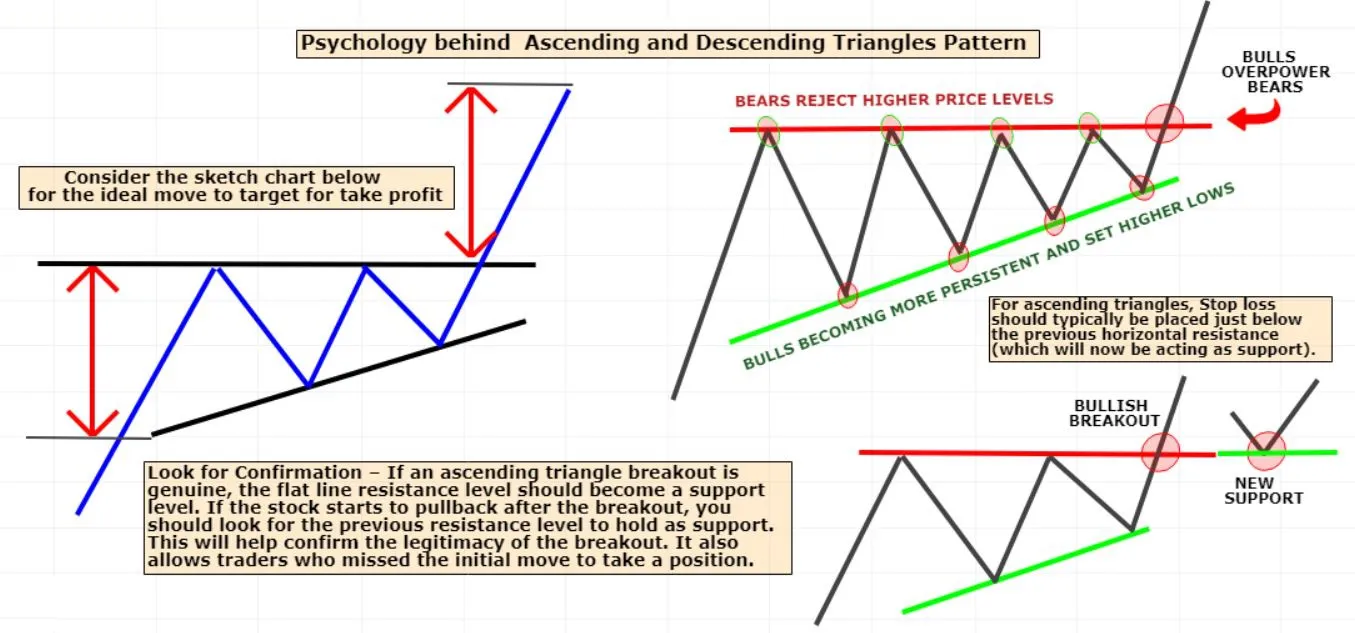
- Ascending triangle pattern
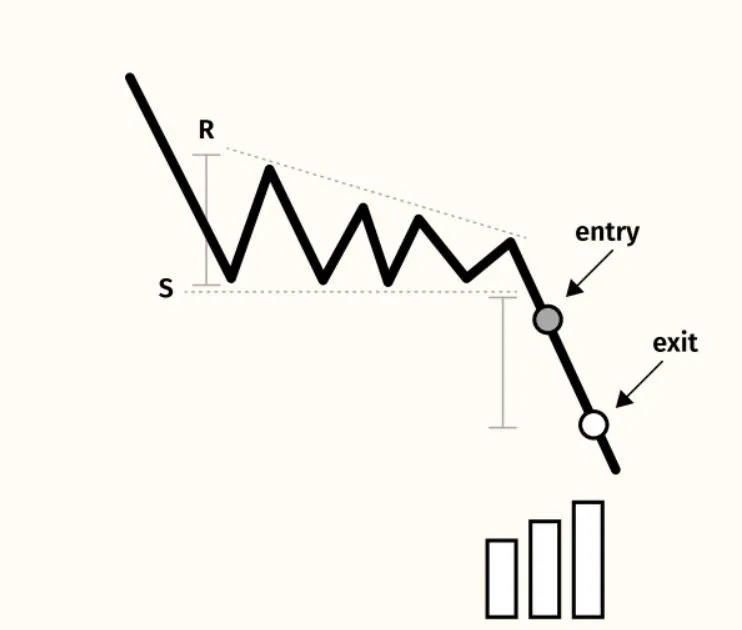
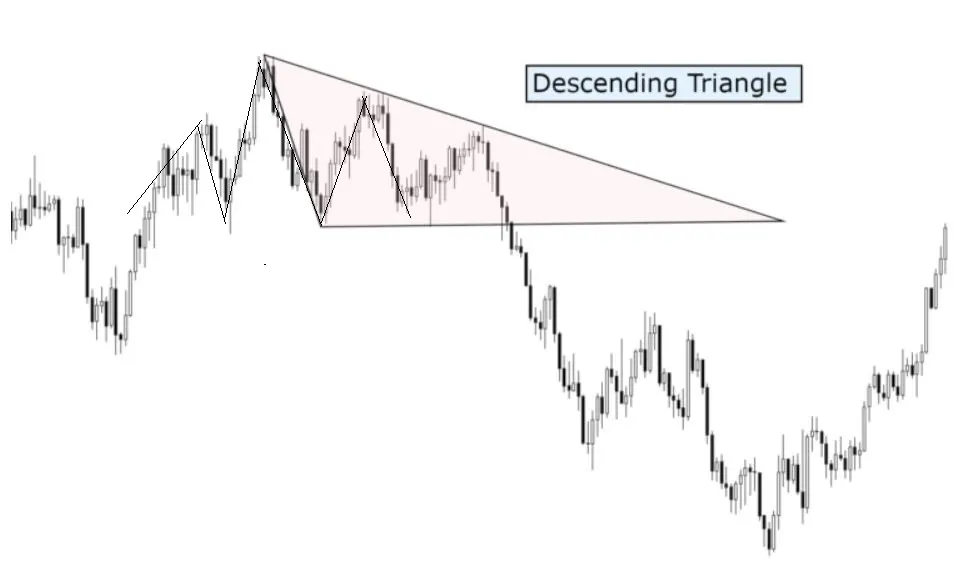
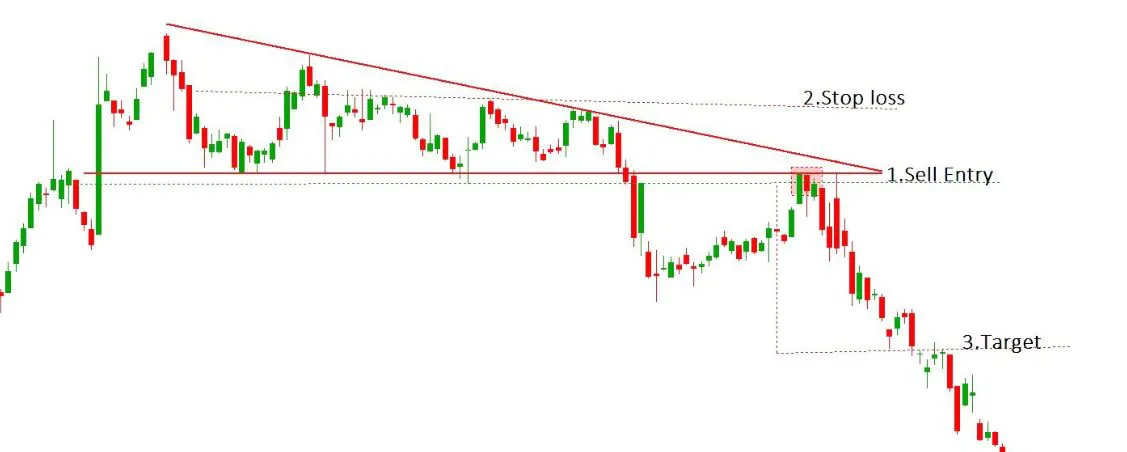
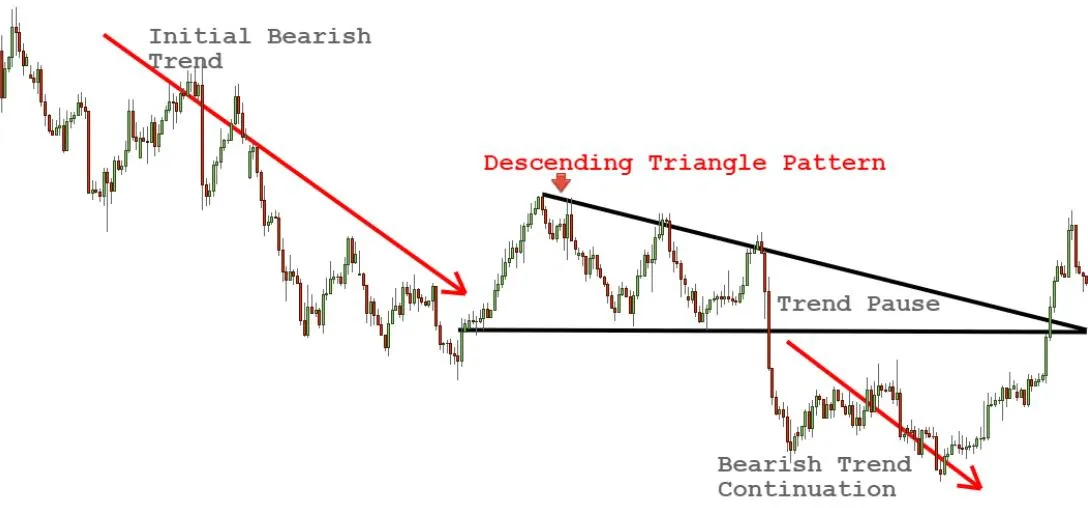
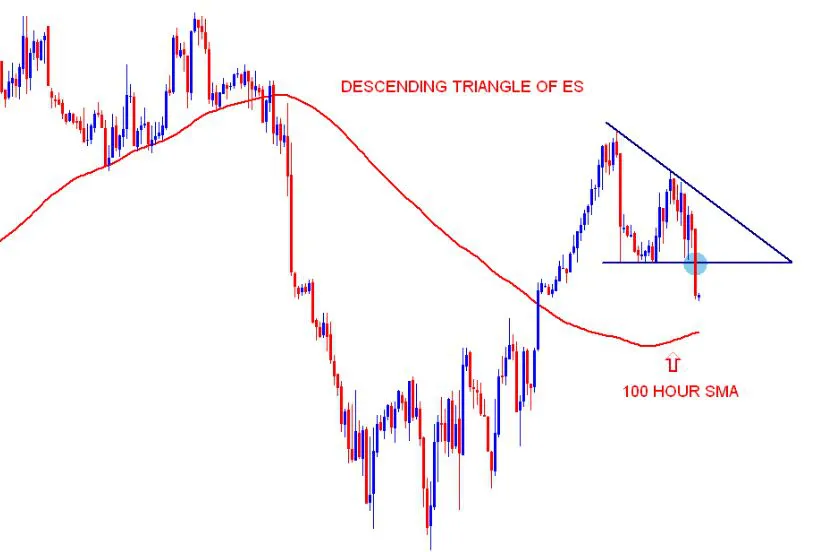
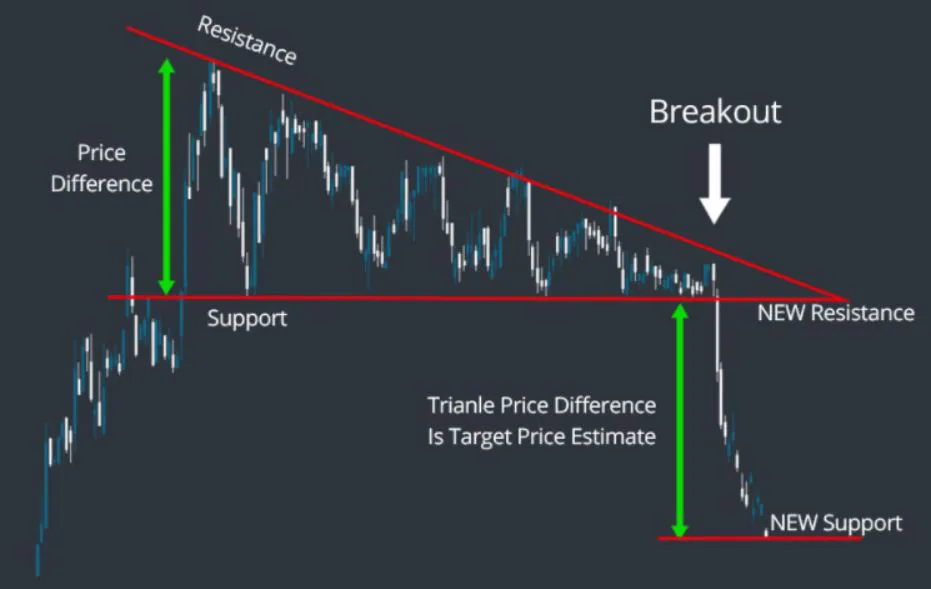
- Descending triangle pattern
TRIANGLES
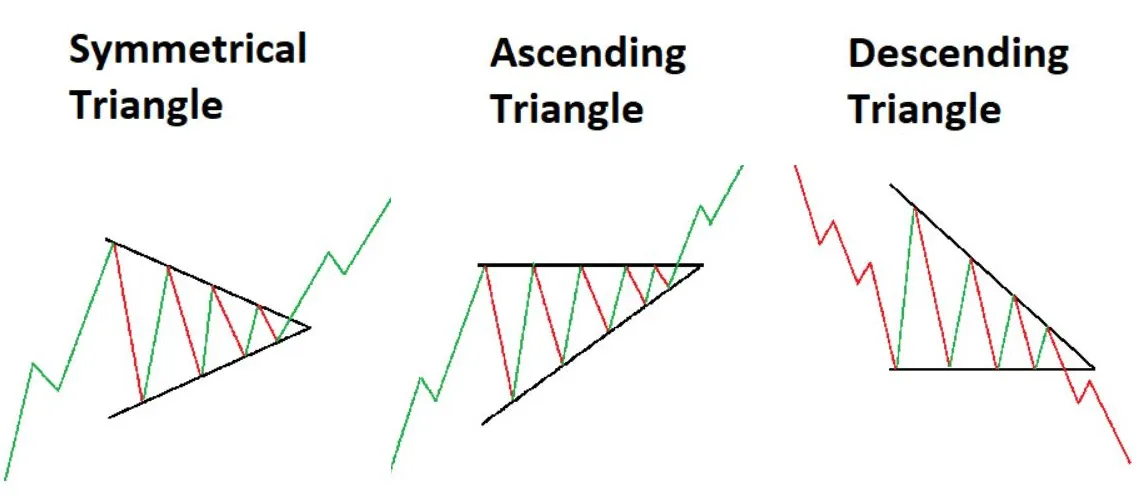
In technical analysis and price action, triangles patterns plays a main role.
A triangles pattern is a chart formation that occurs when the price of an asset moves within a converging range, forming triangle like structure on the chart.