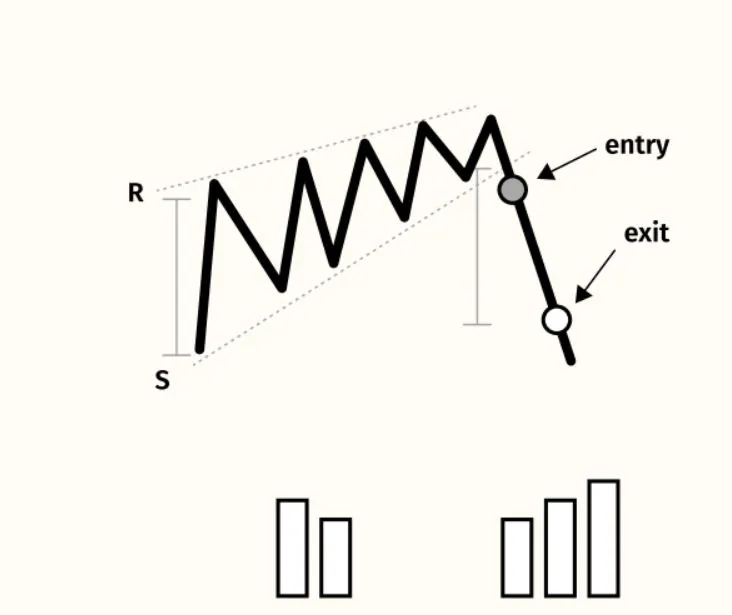
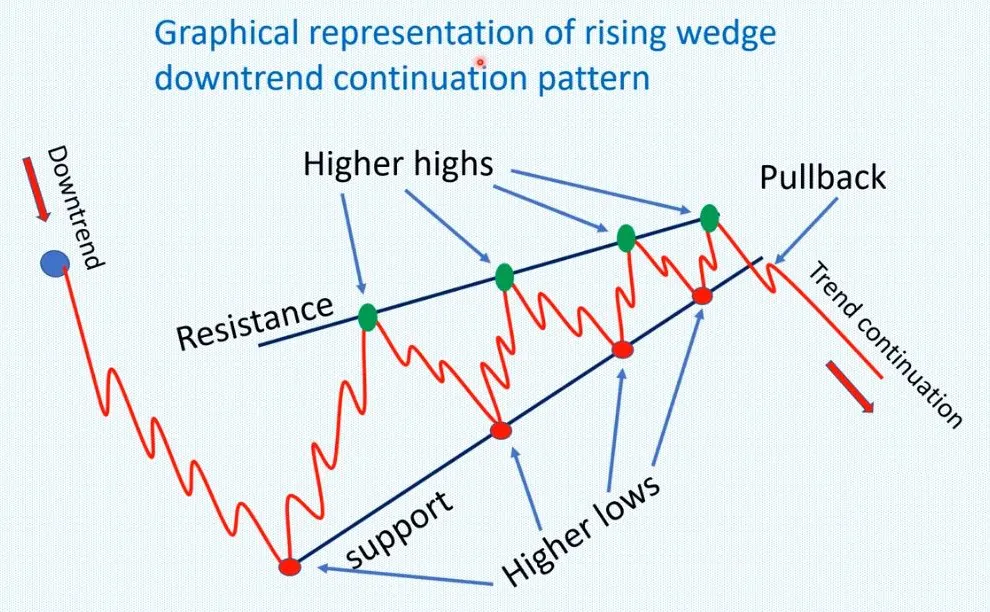
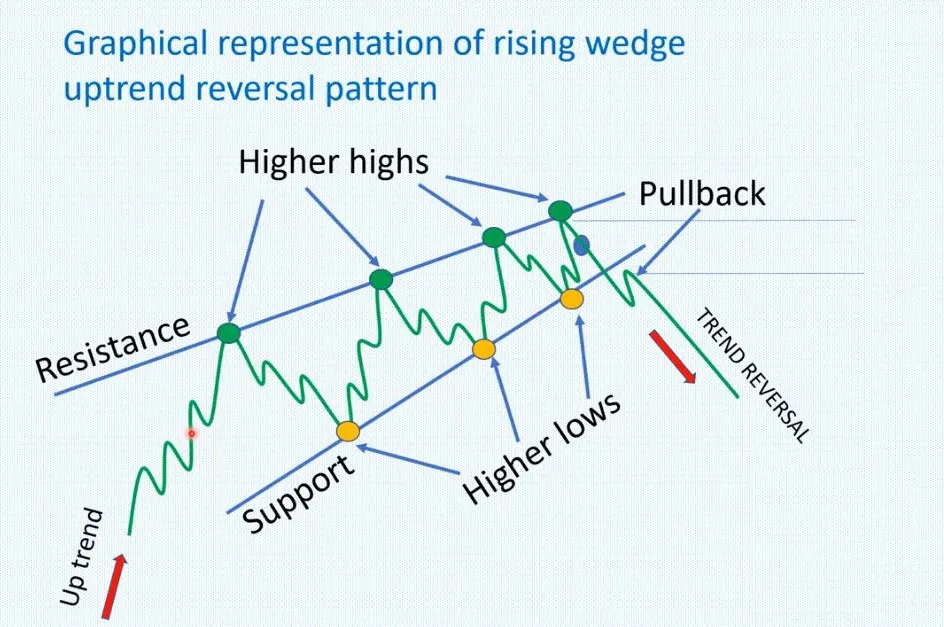
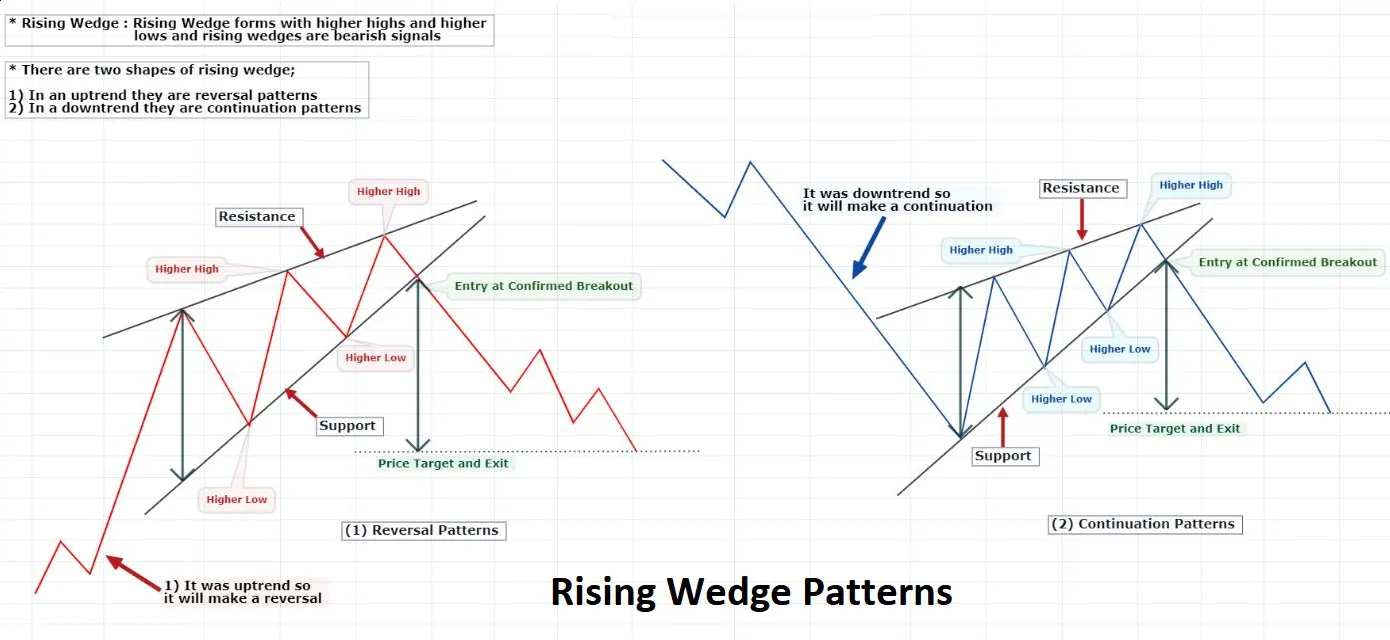
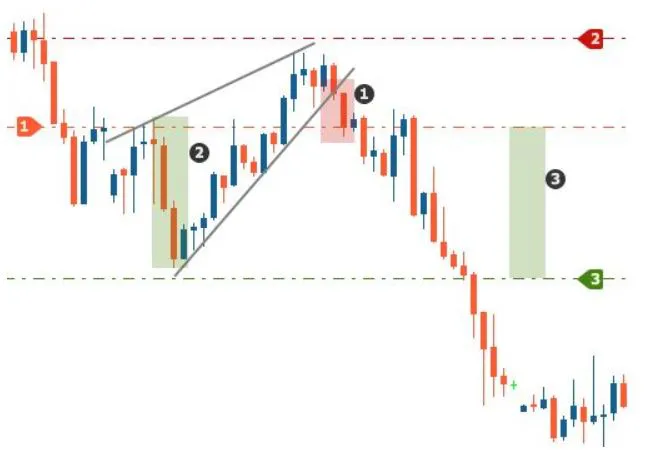
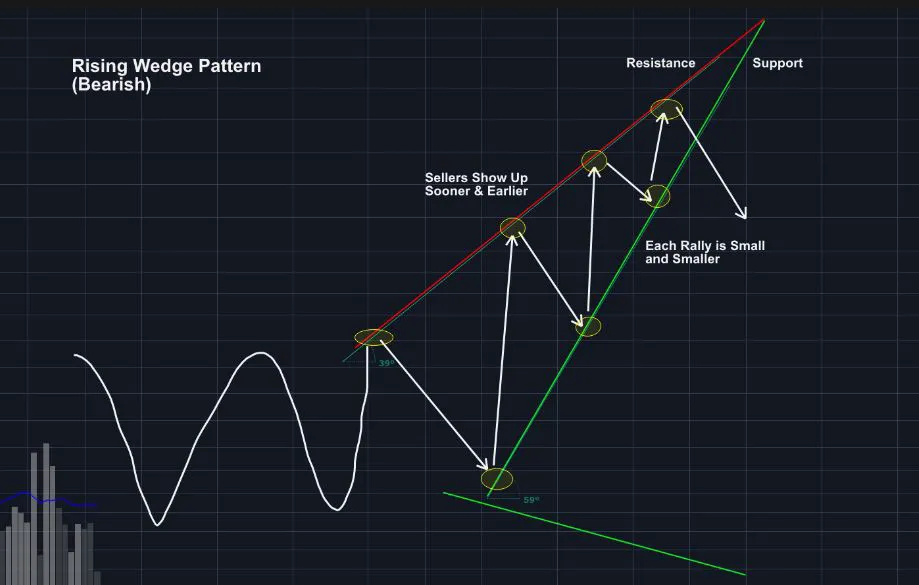
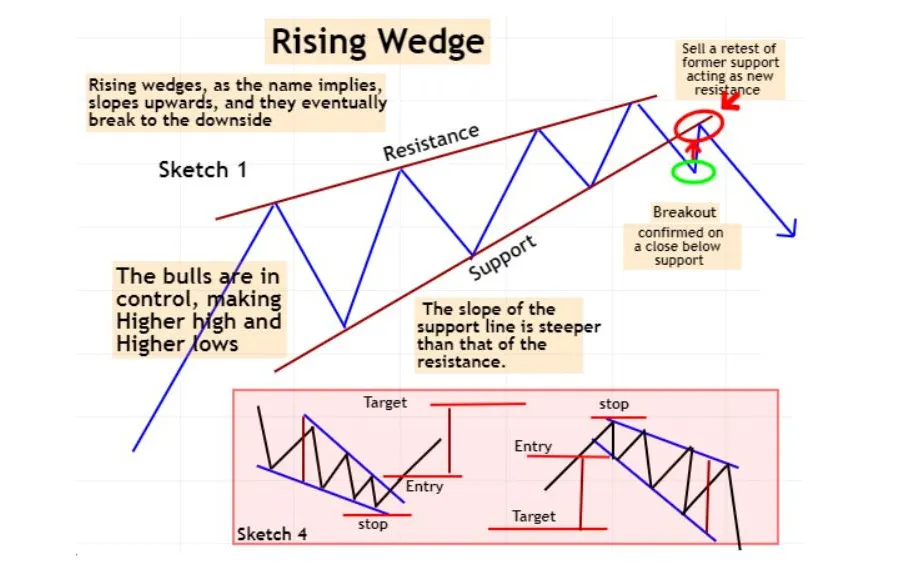
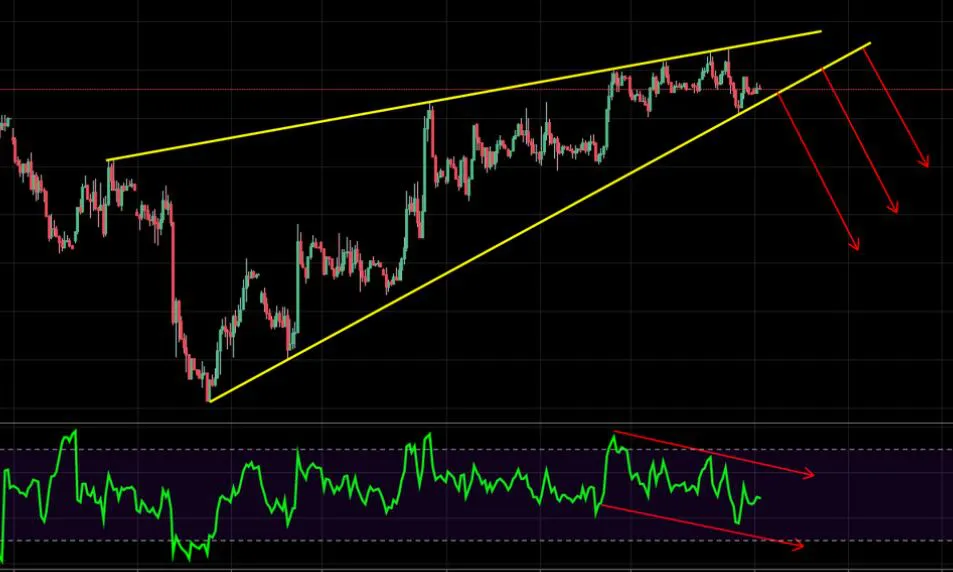
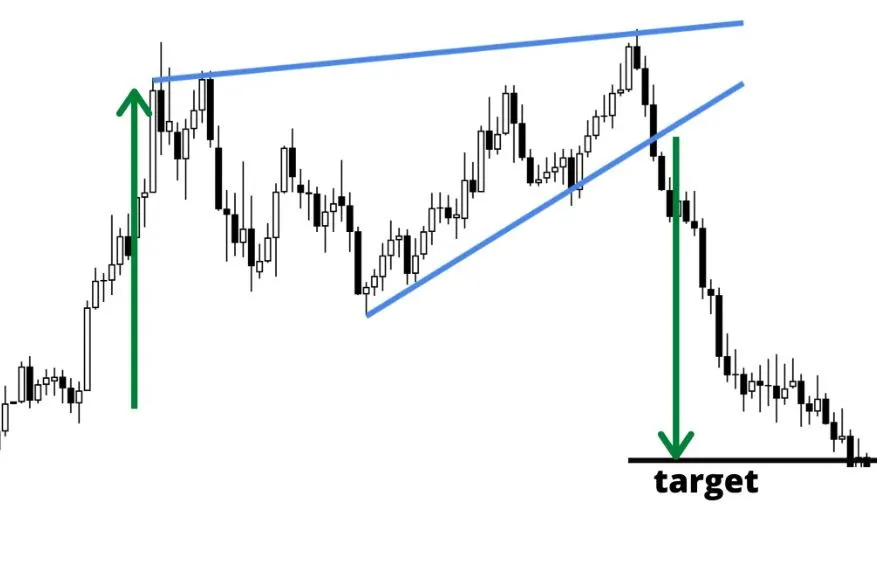
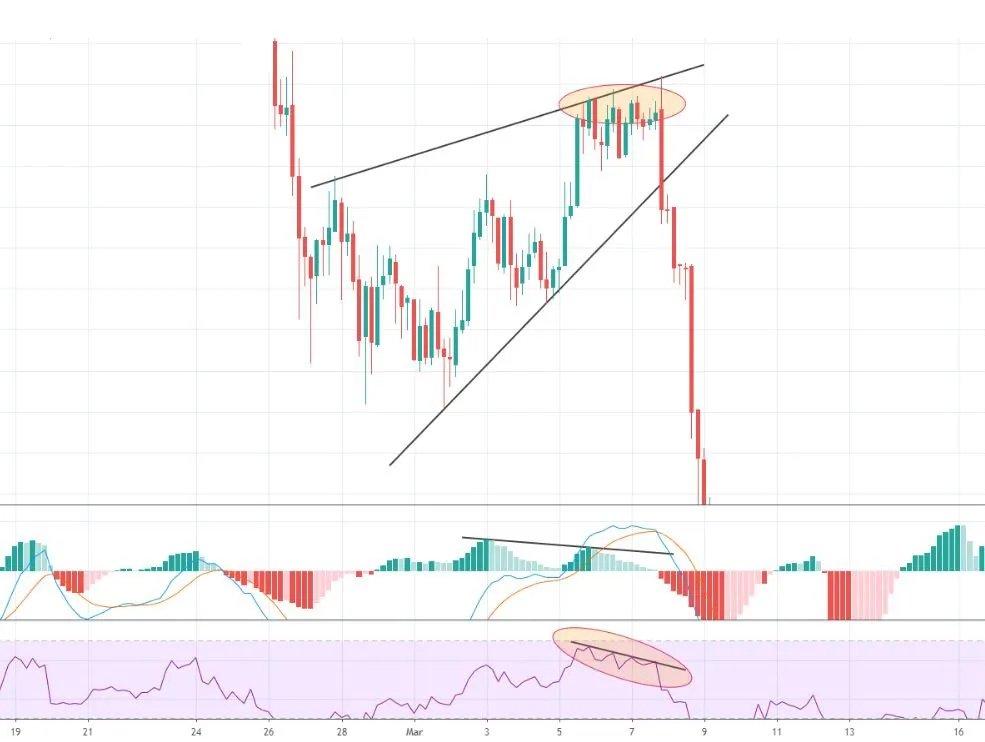
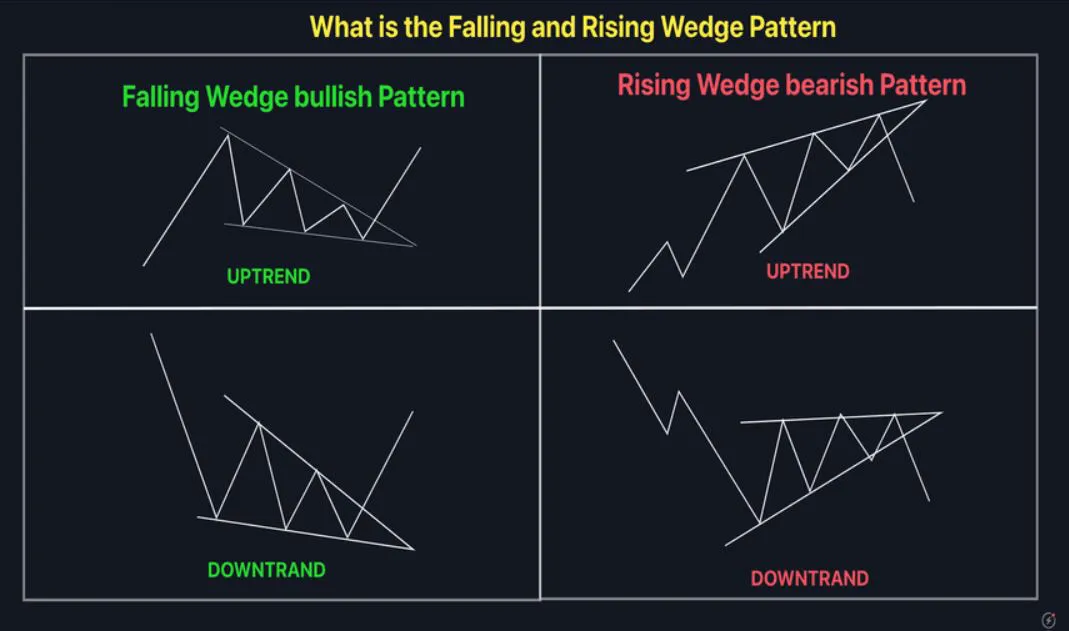
- Rising wedge
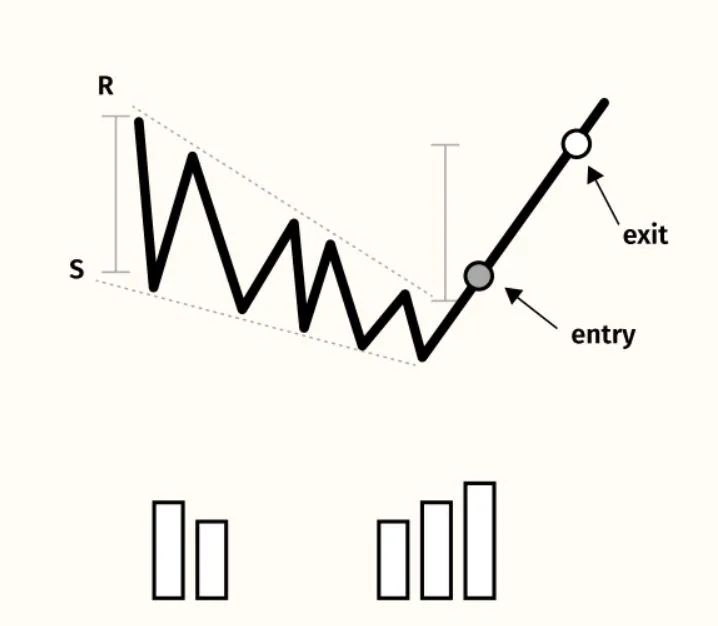
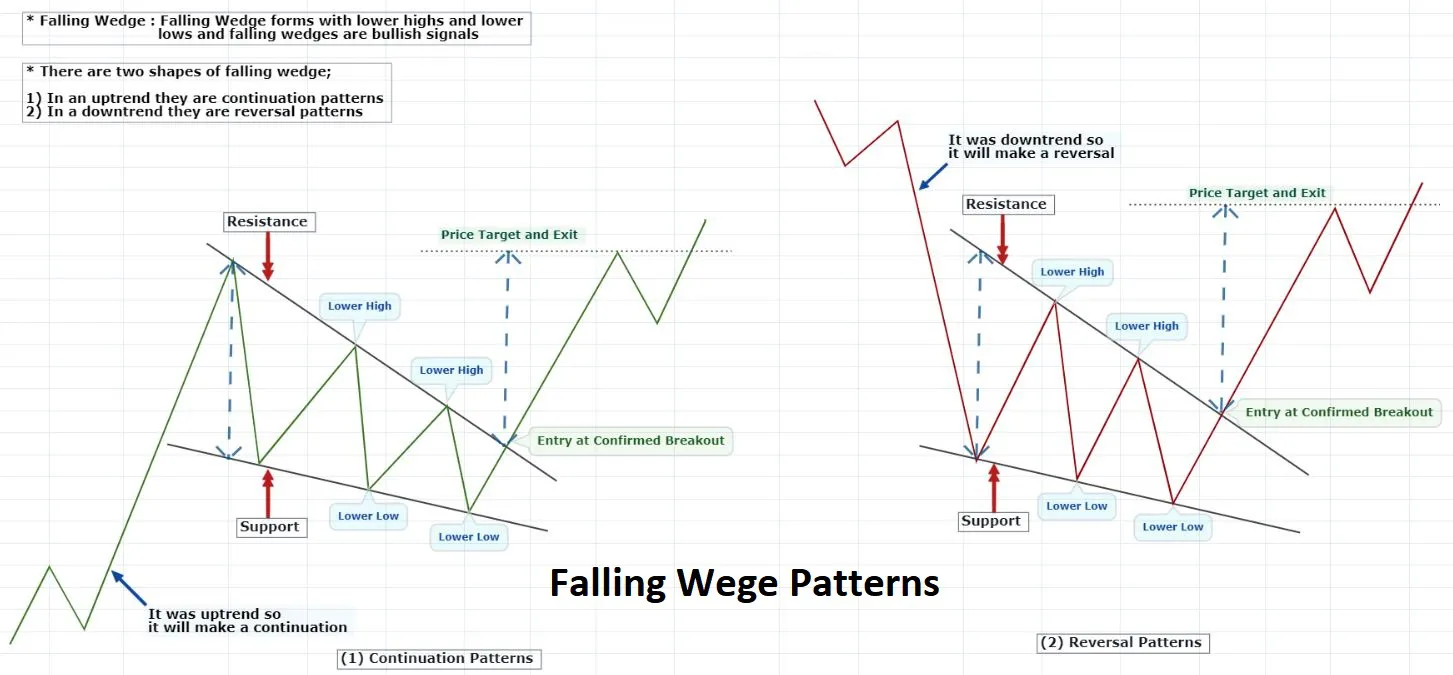
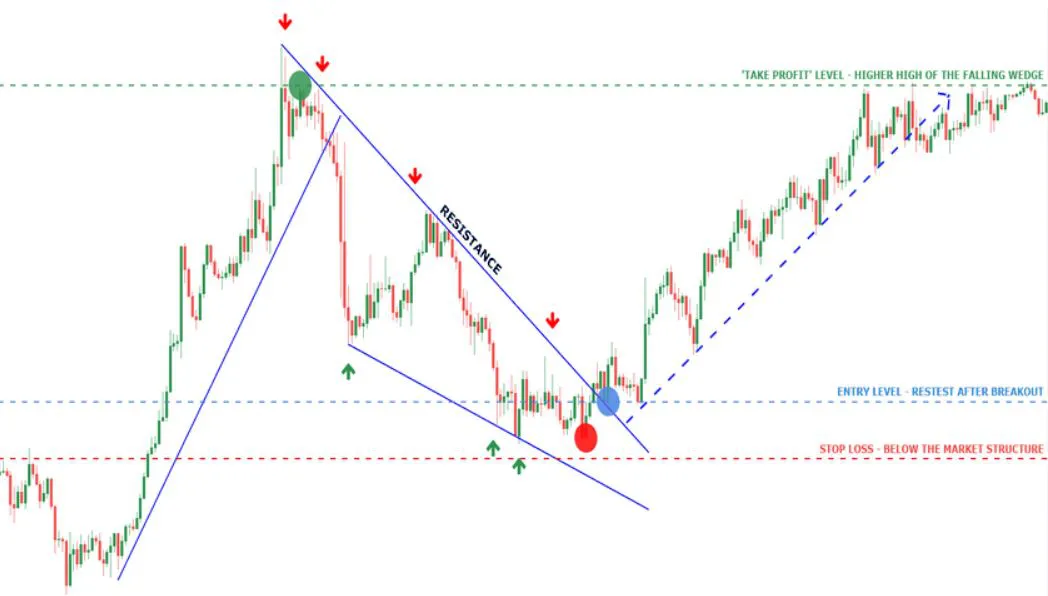
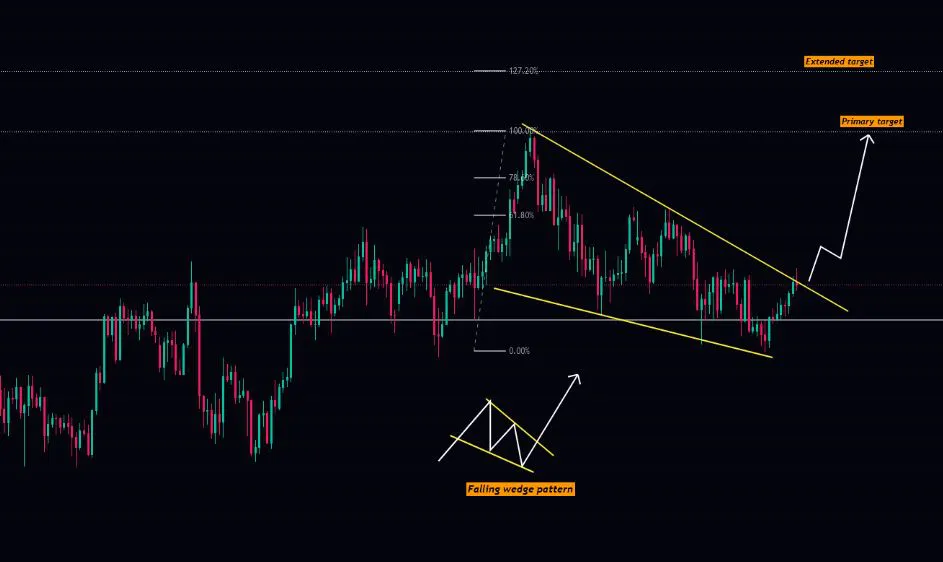
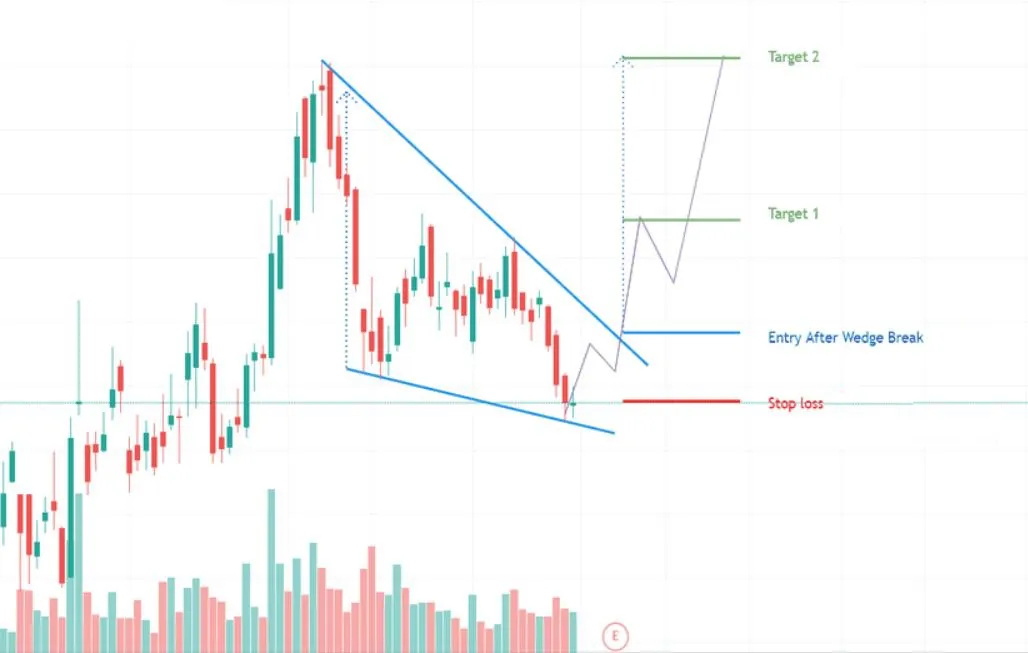
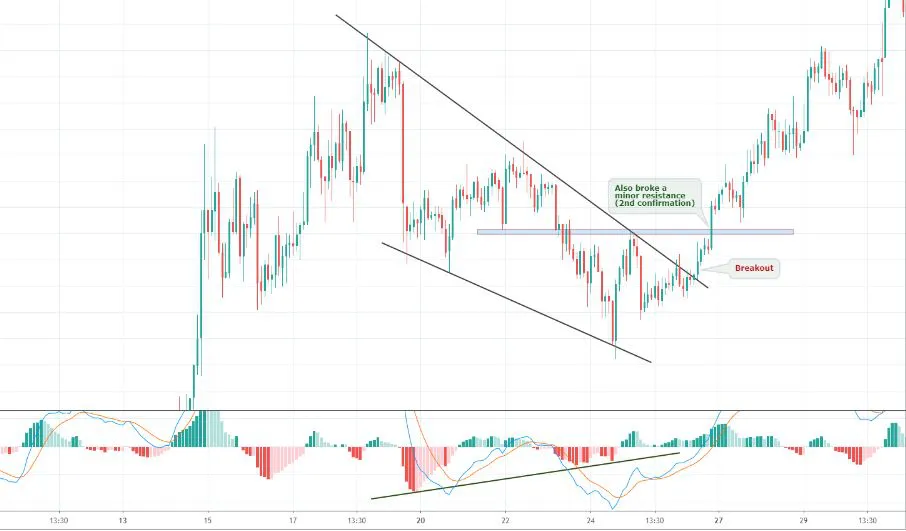
- Falling wedge
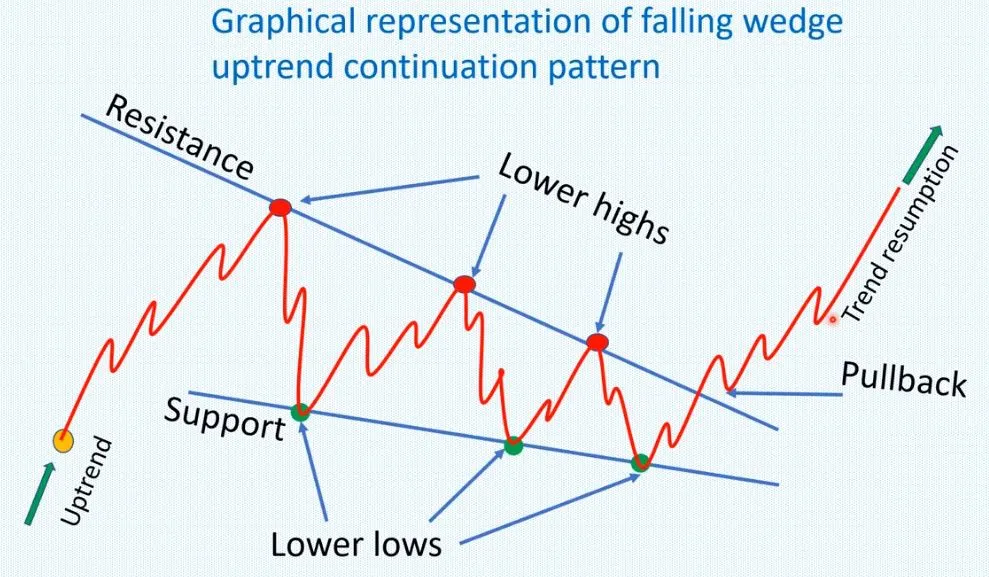
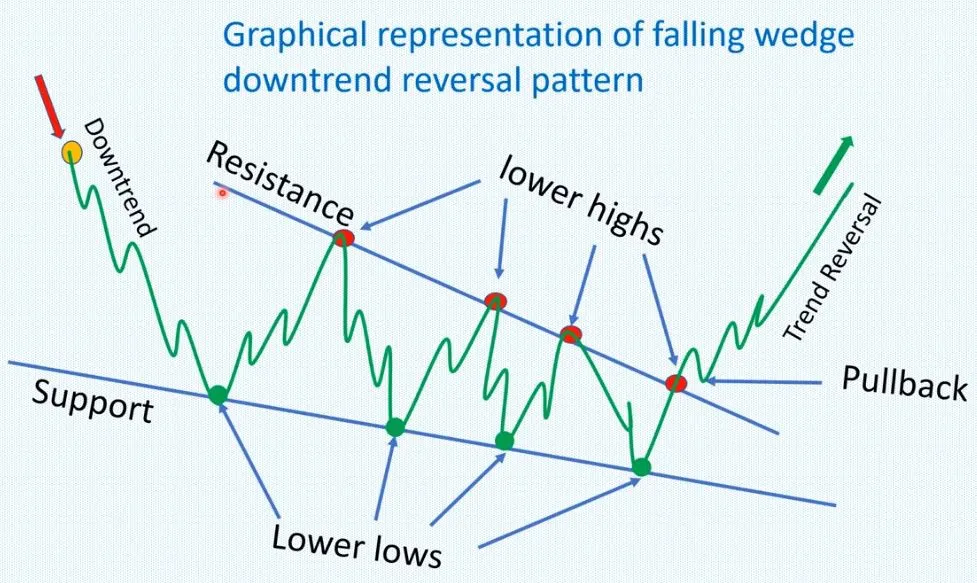
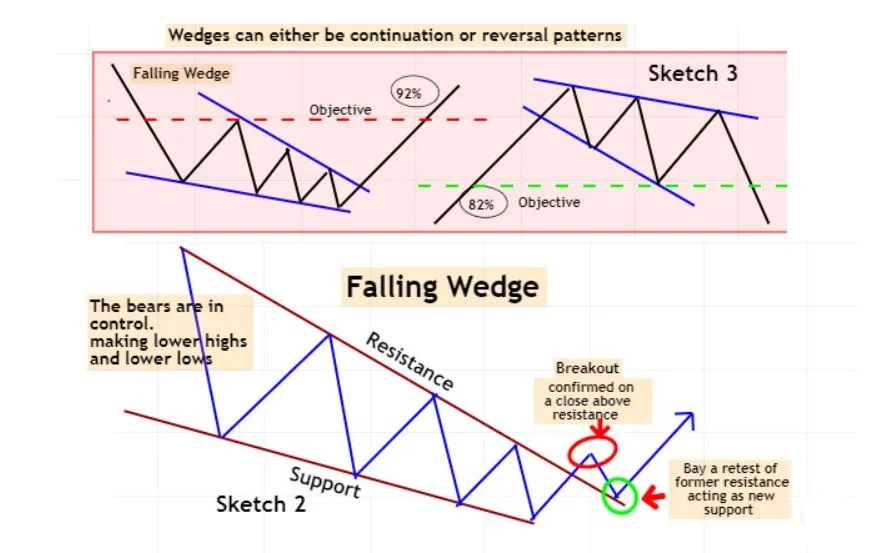
WEDGES
In technical analysis, a wedge is a price pattern that forms when the price of an asset moves in a narrowing range, forming a triangle or wedge shape.
Wedges are chart patterns formed by converging two trend lines and can be both a continuation or reversal pattern.
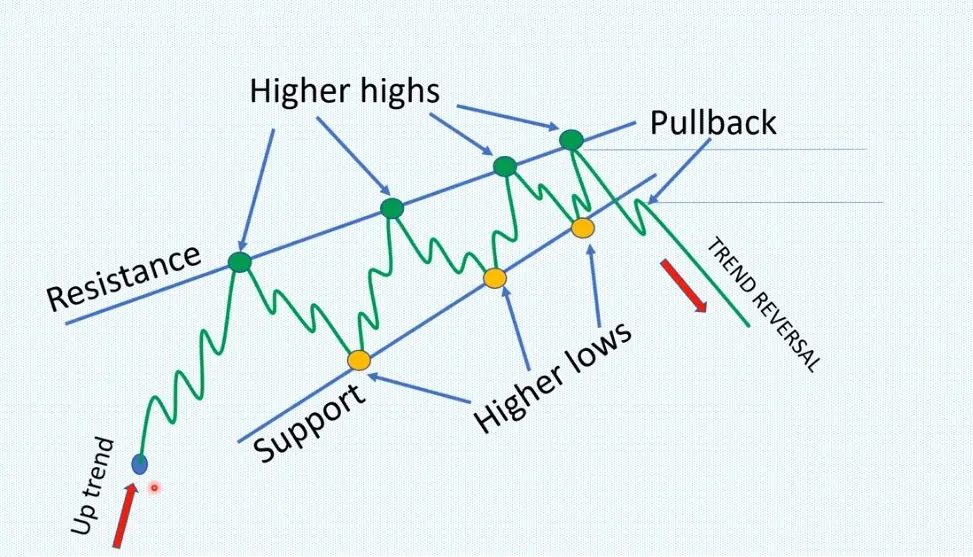
Wedges are often used as a signal for potential trend reversal. Traders typically look for the breakout of the pattern, which occurs when the price moves outside of the wedge formation, as a confirmation of the new trend direction.