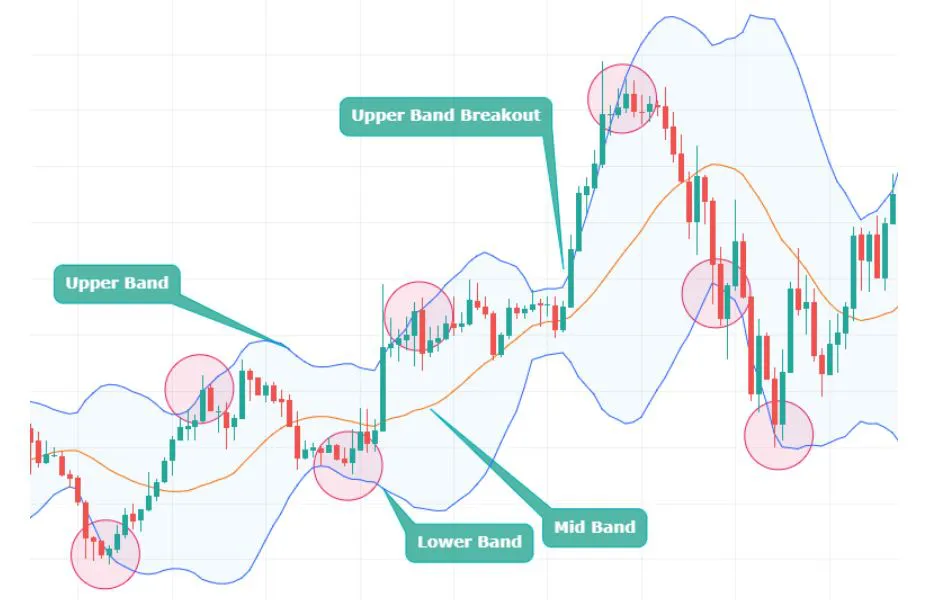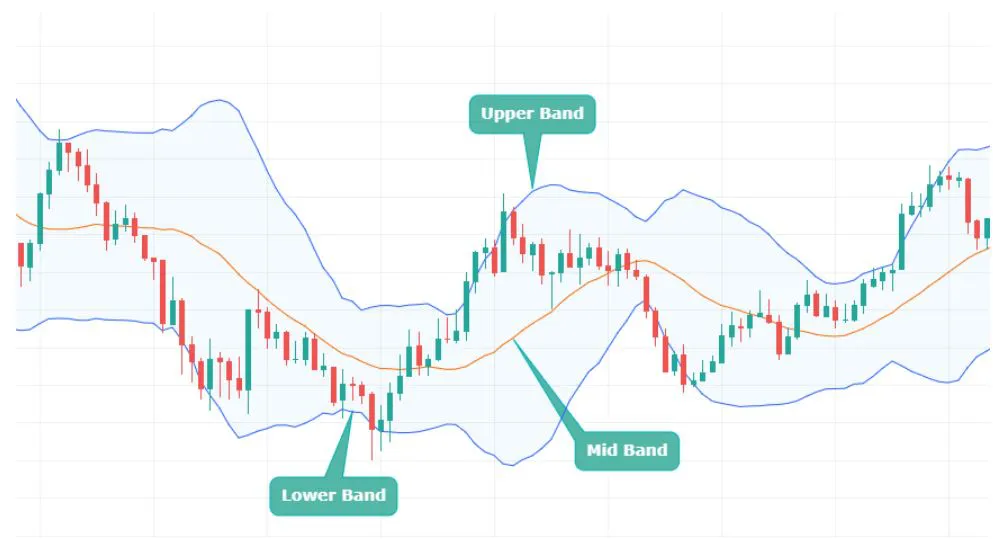
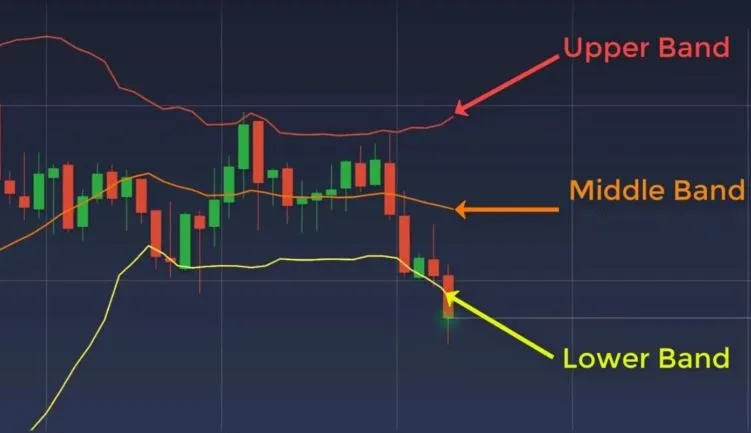
- Middle Band: This is the middle line plotted on the chart, which is typically an SMA of the closing prices over a certain number of periods.
- Upper Band:This is the top line of the three lines plotted on the chart. It is typically set two standard deviations away from a simple moving average (SMA).
- Lower Band:This is the middle line plotted on the chart, which is typically an SMA of the closing prices over a certain number of periods.
Bollinger Bands
Bollinger Bands are the most popular trading indicator created by John Bollinger.
These bands are commonly used to identify market volatility and potential overbought or oversold conditions. They are created by drawing two lines that are a certain number of standard deviations away from a moving average.
In simple term, Standard deviation means how much something varies or far away from its average line.
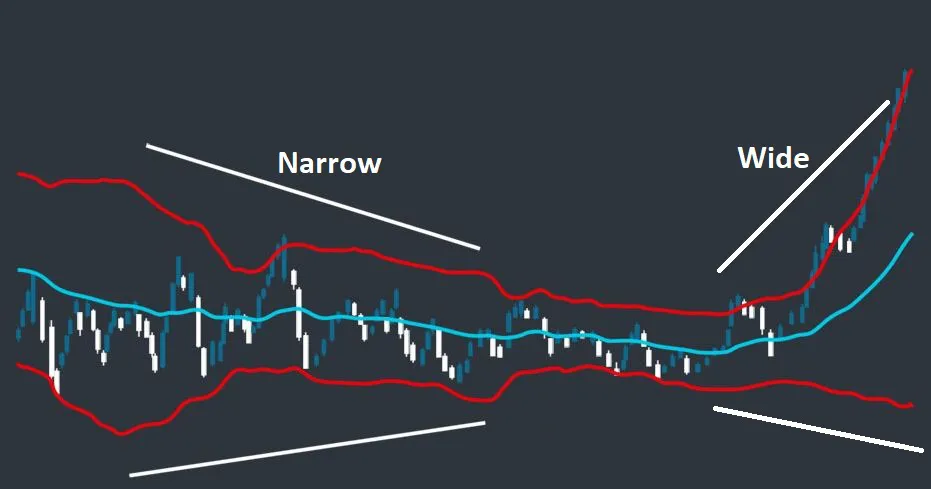
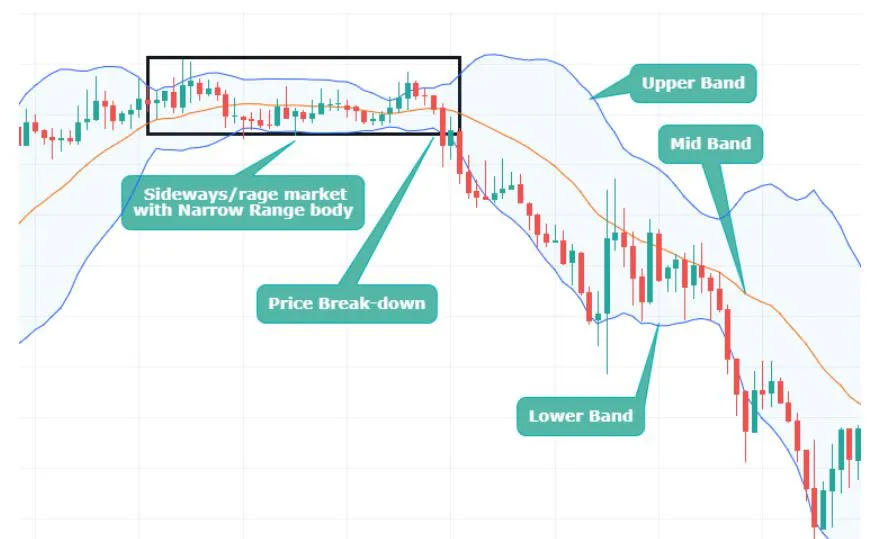
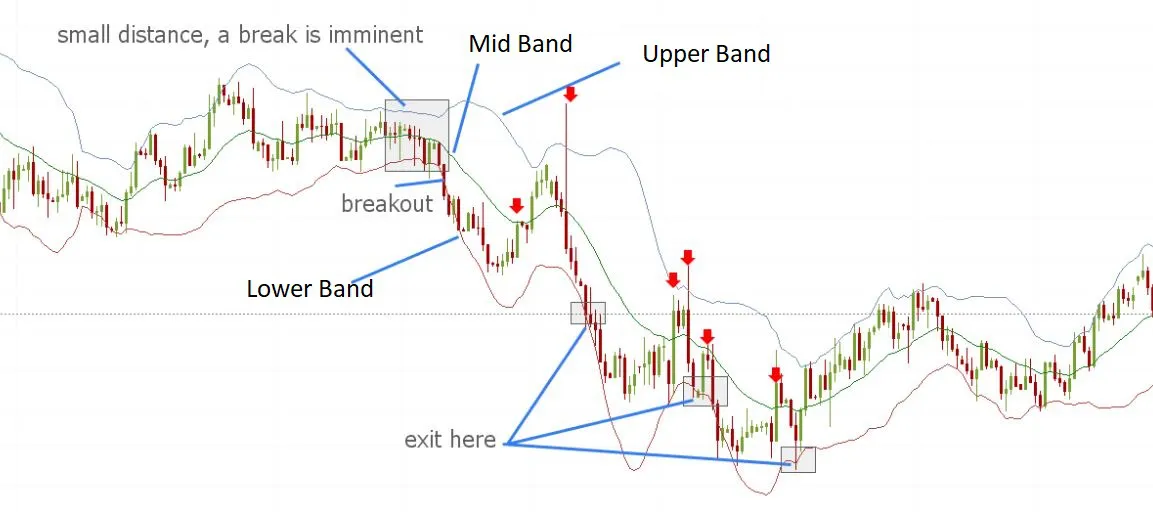
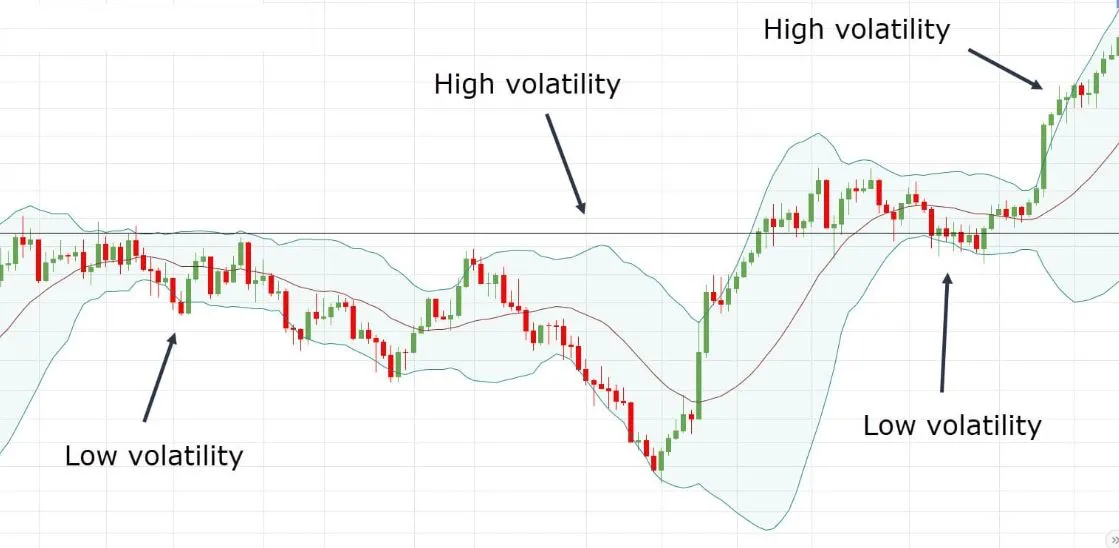
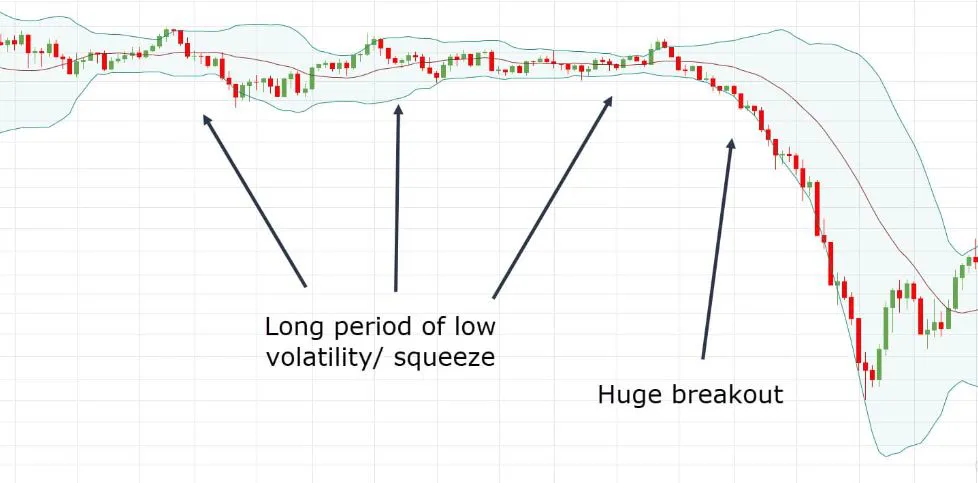
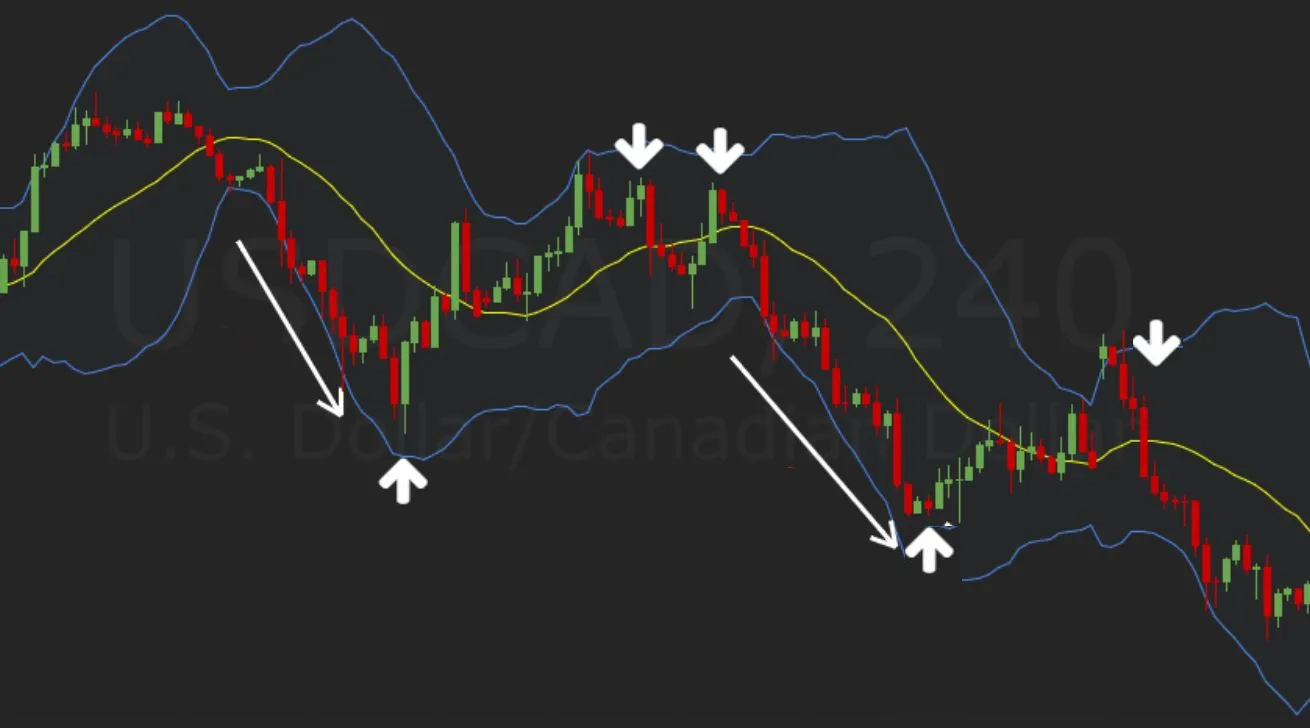
When the bands are narrow, it indicates that the market is experiencing low volatility.
When the bands are wide, it indicates that the market is experiencing high volatility.