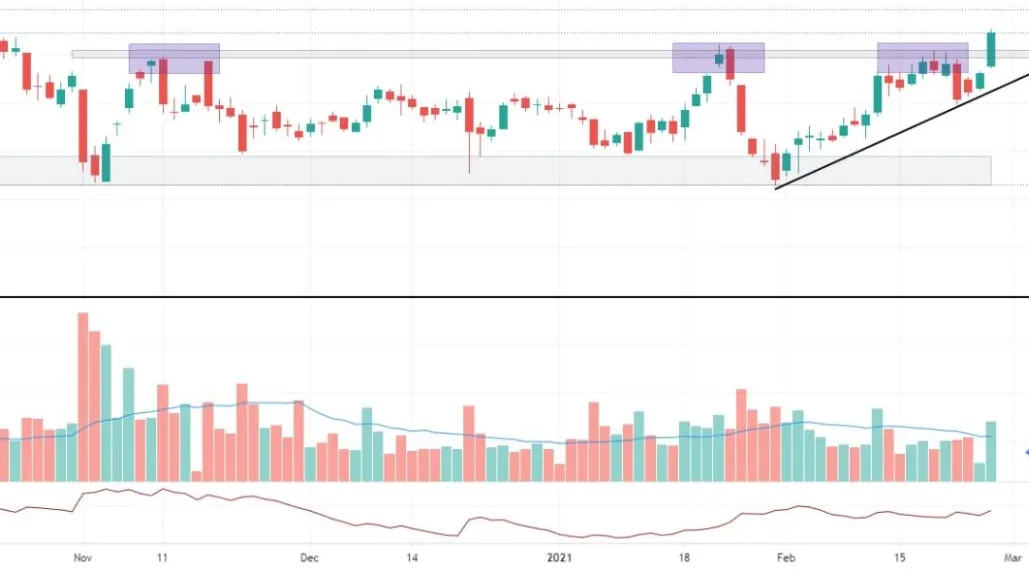
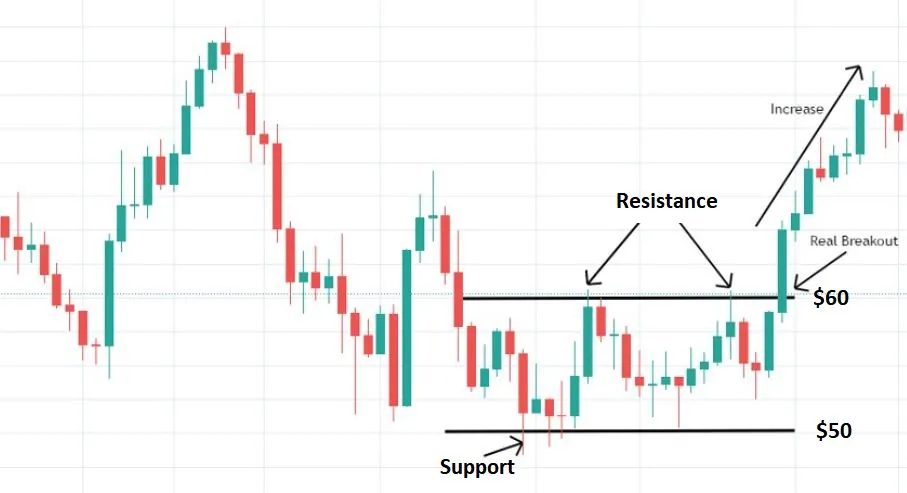
- Breakouts are often accompanied by high trading volume, which can confirm the strength of the move.
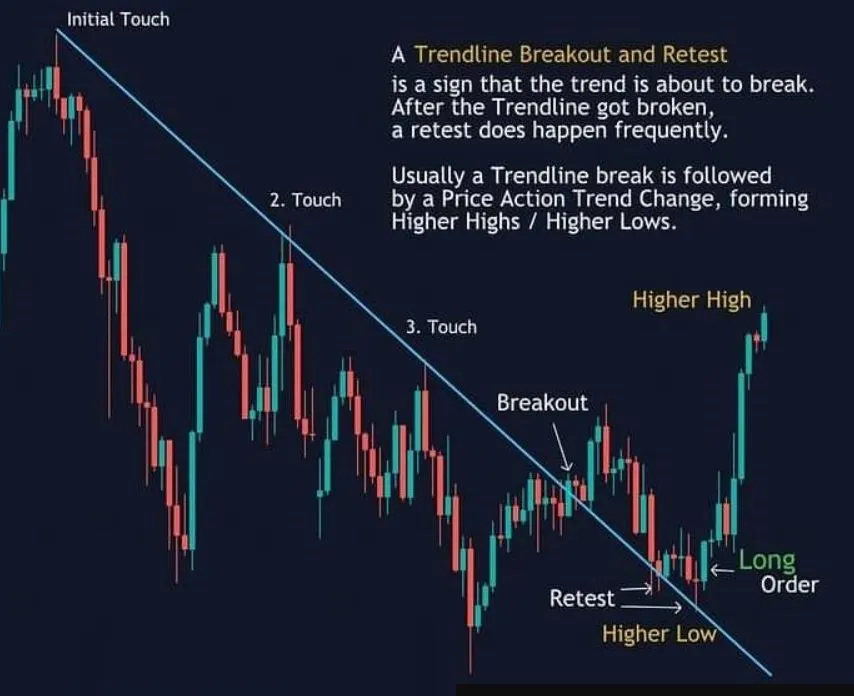
- Traders can use breakouts to identify potential entry and exit points, as well as to set stop-loss and take-profit levels.
- Breakouts can occur in various timeframes, from short-term intraday moves to longer-term trend reversals.
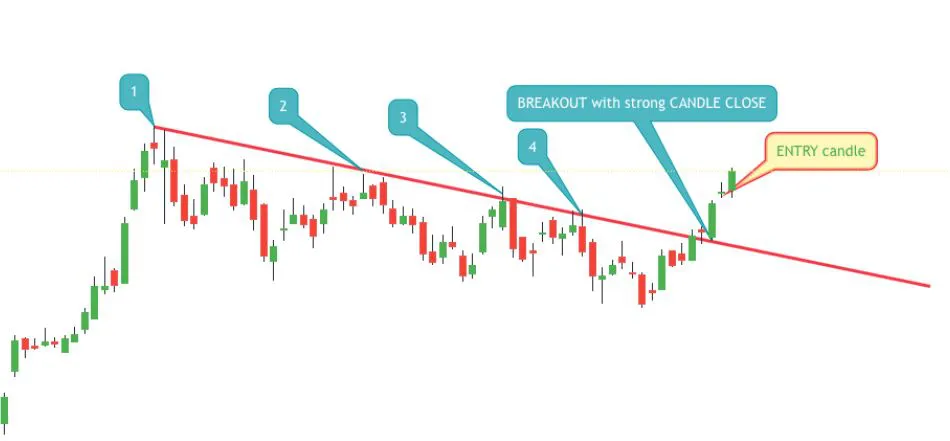
- Traders should use additional technical analysis and indicators to confirm the strength of the Breakout and avoid false breakouts.
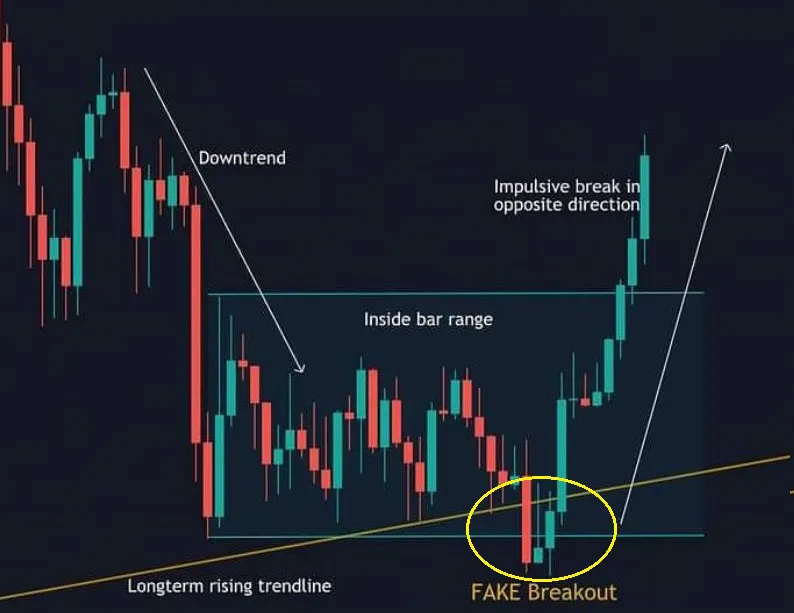
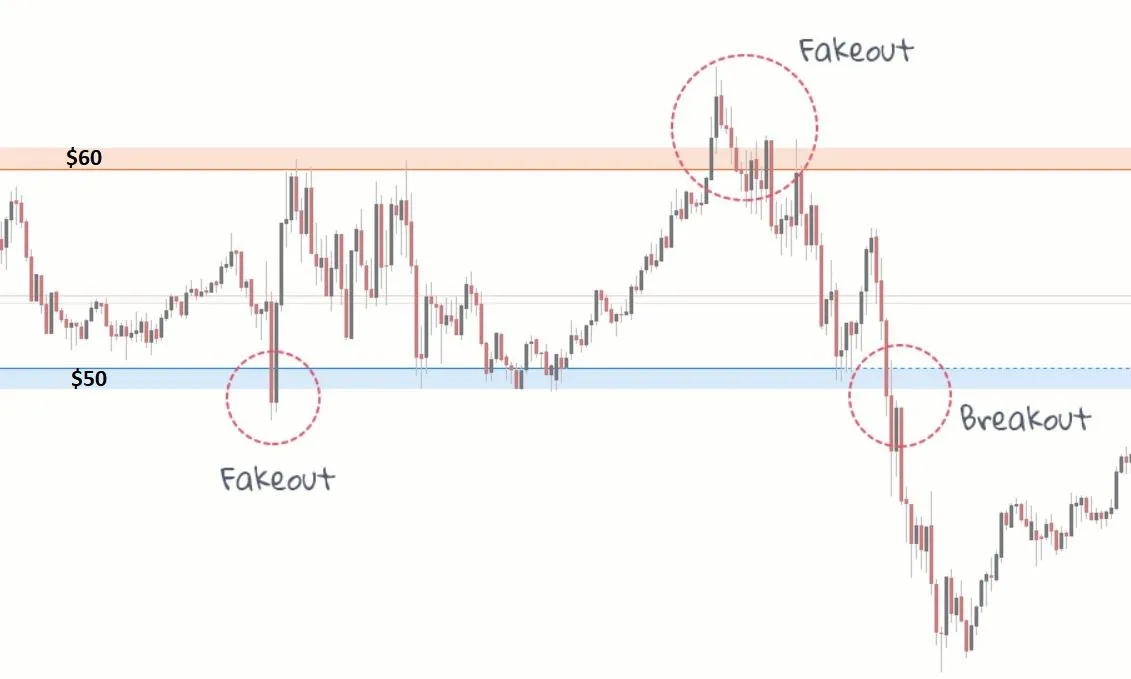
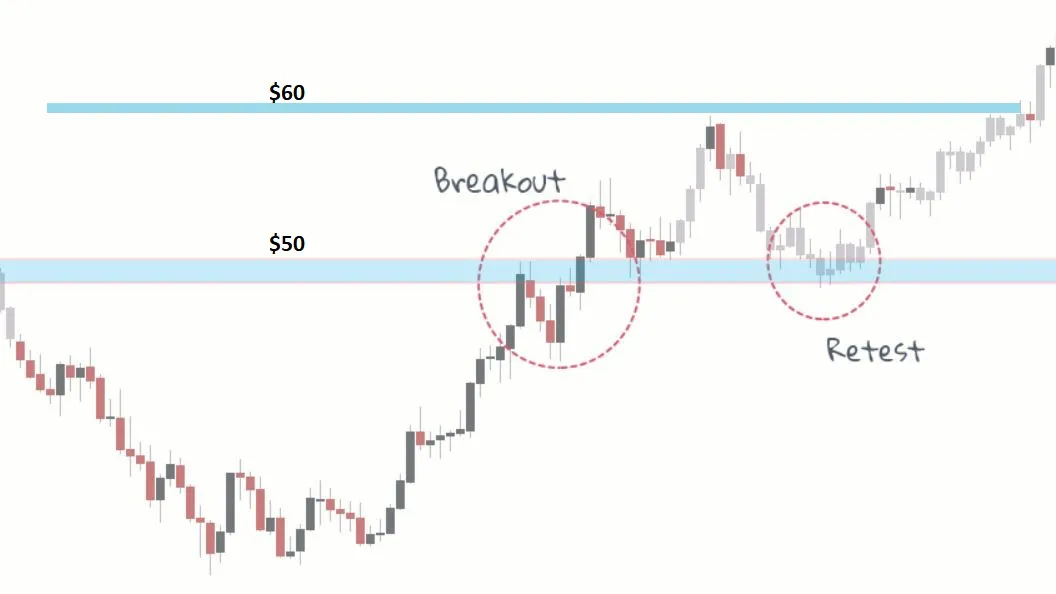
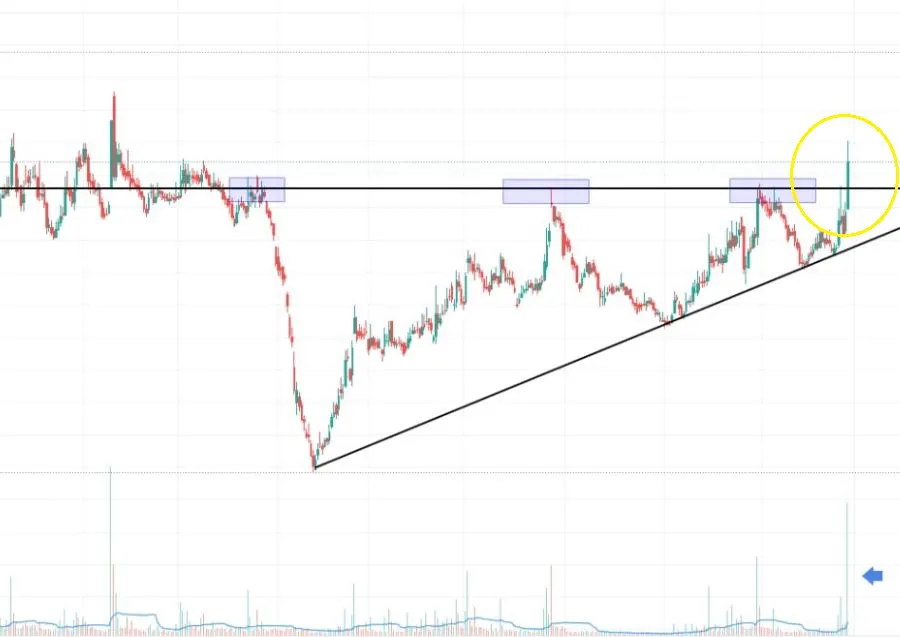
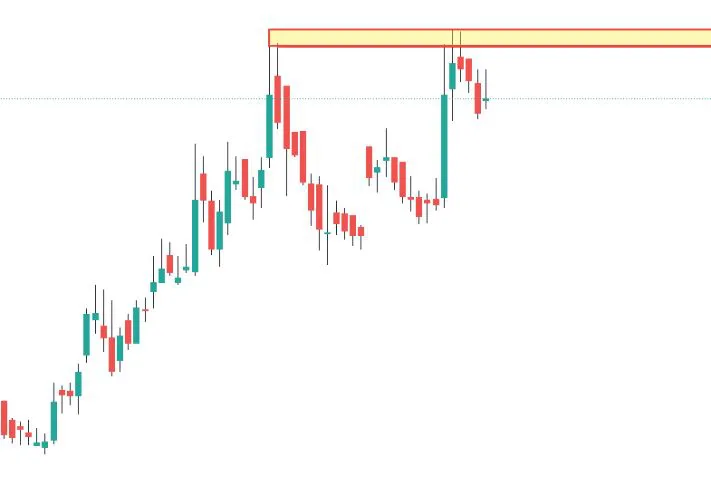
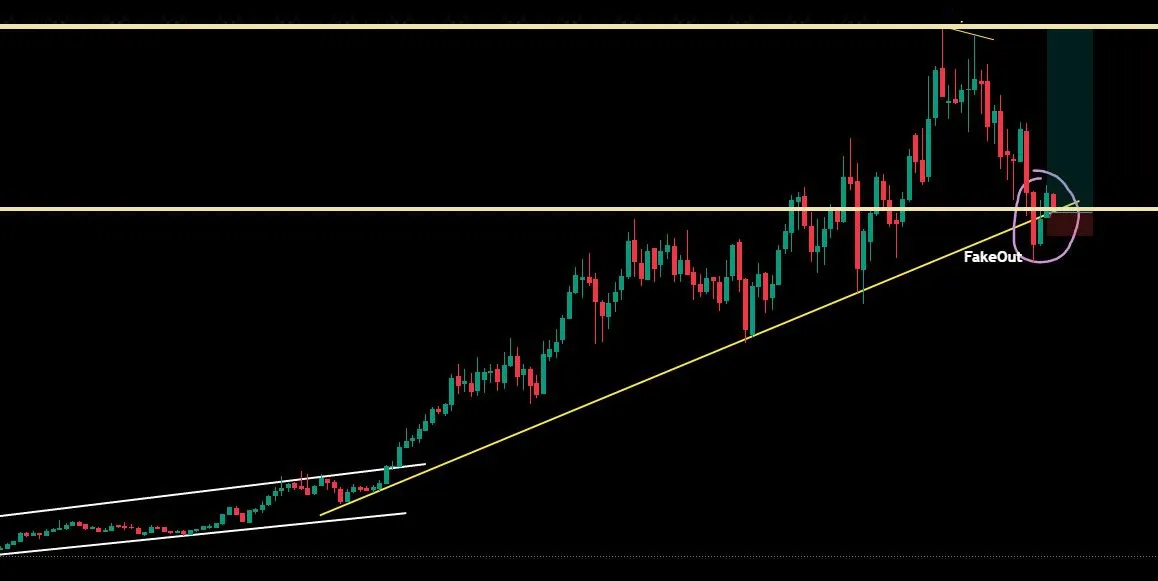
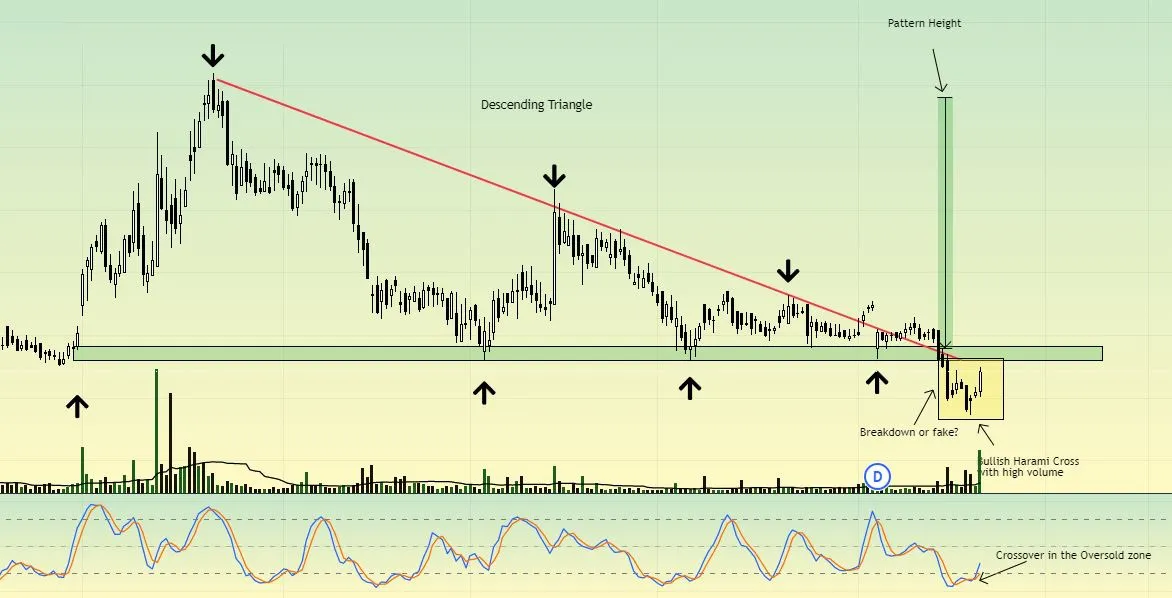
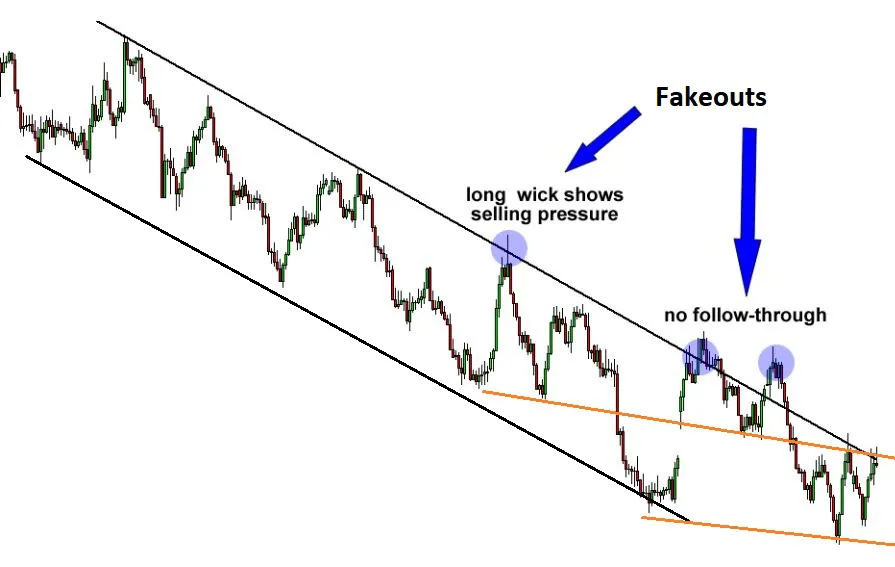
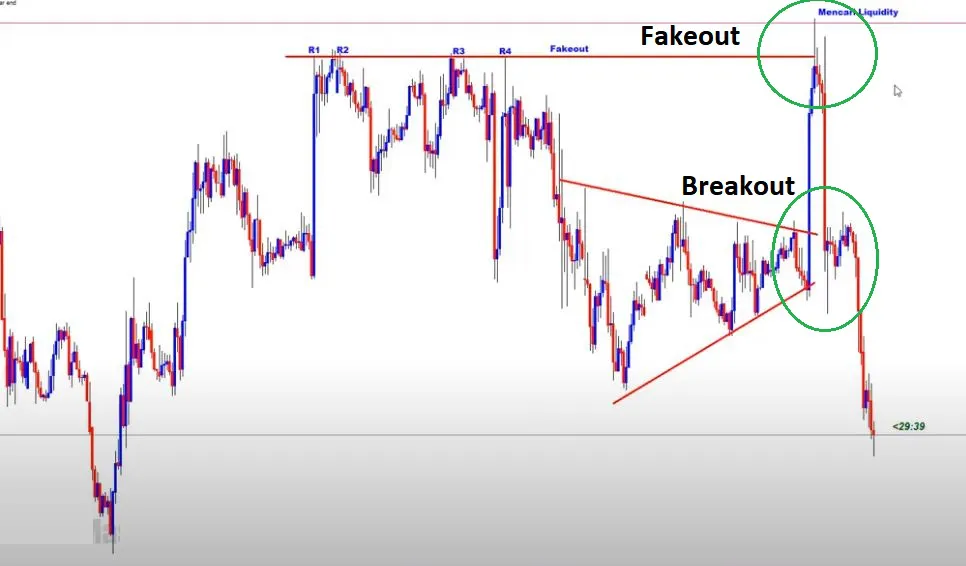
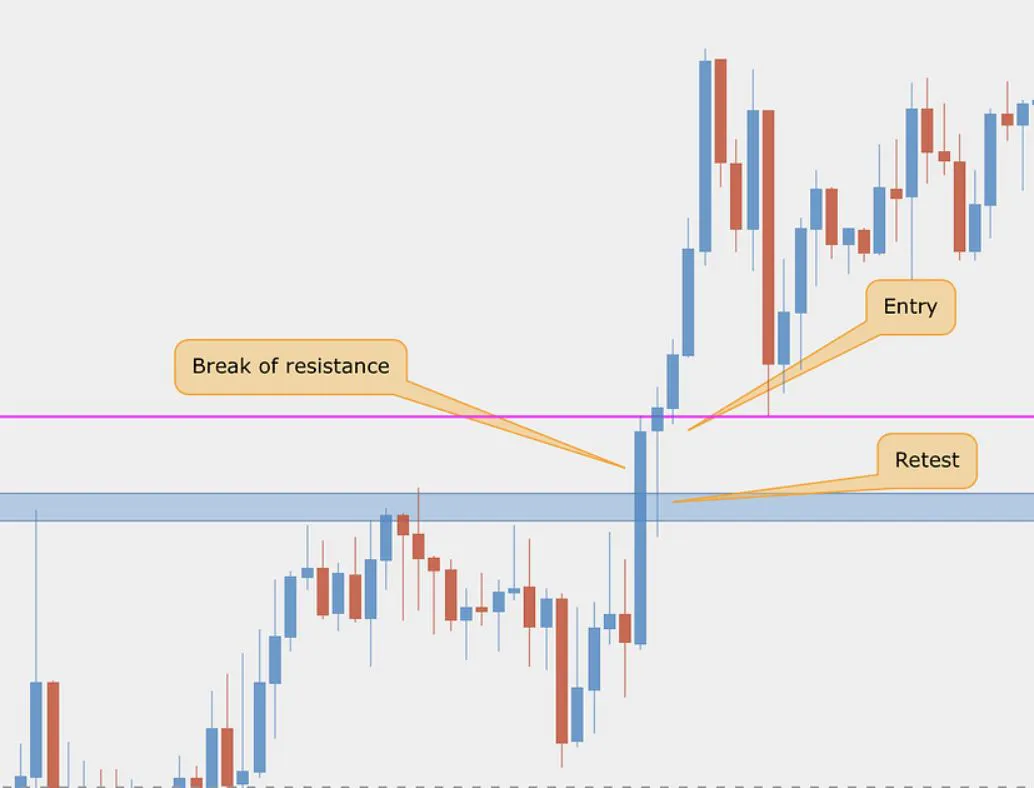
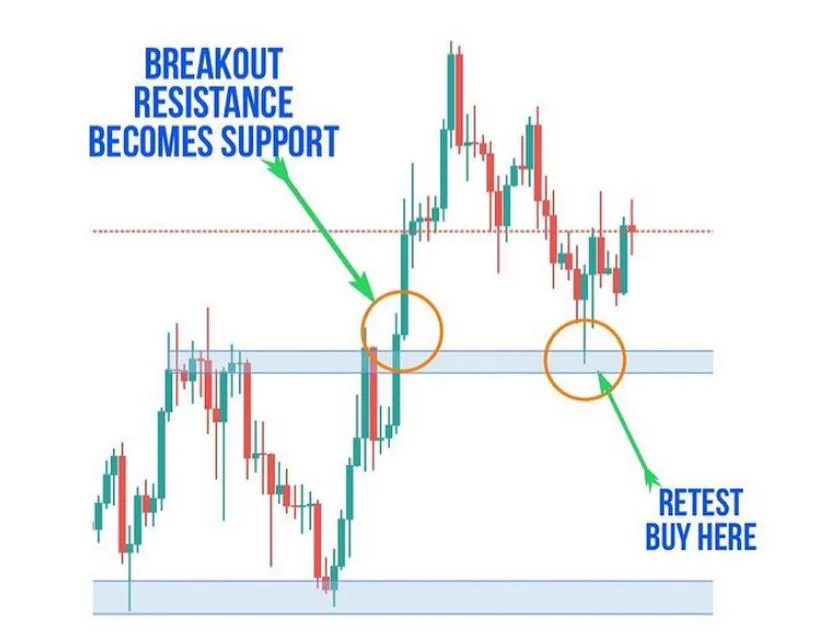
Breakout , Fakeout & Retest
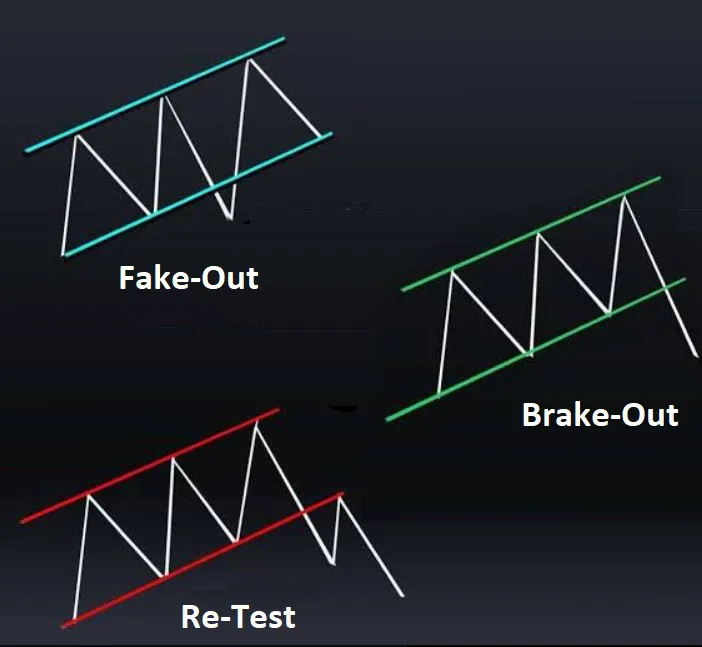
Breakout, Fake-out and Retest are the terms used in technical analysis to describe price movements that occur when an stock's price moves above or below a key support or resistance level.