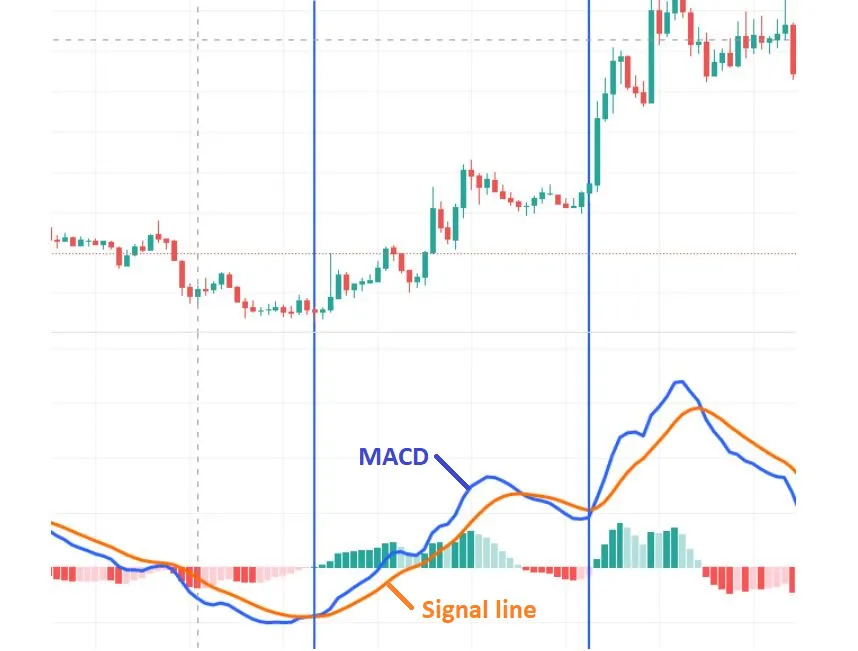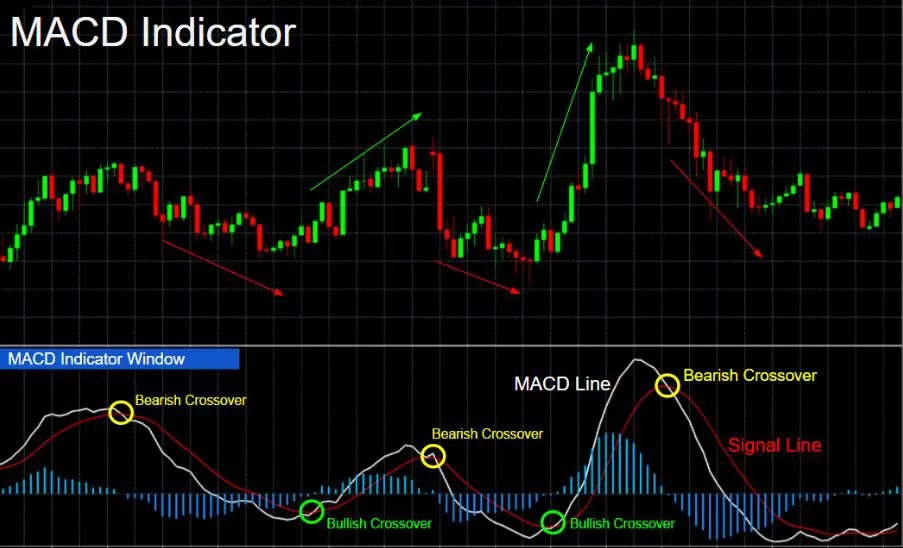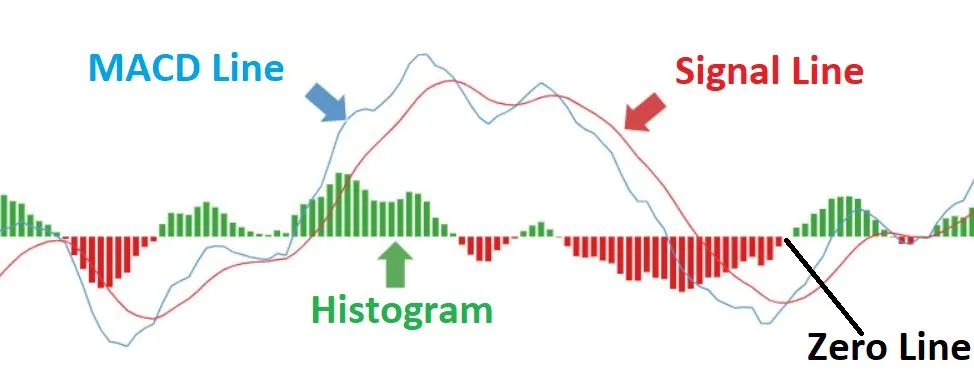
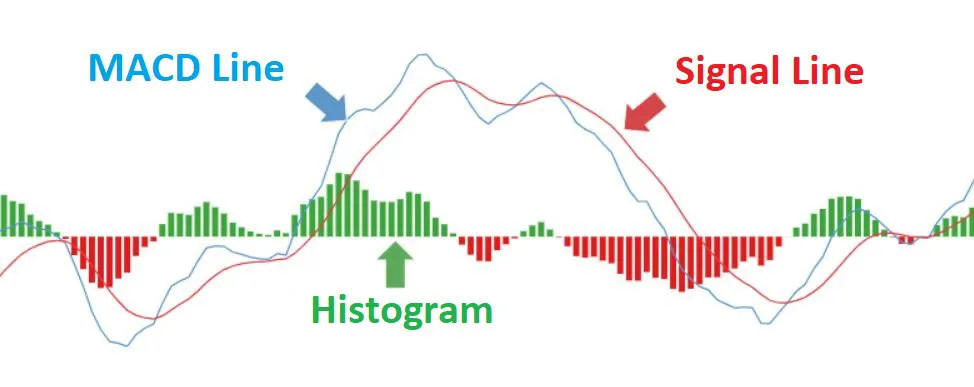
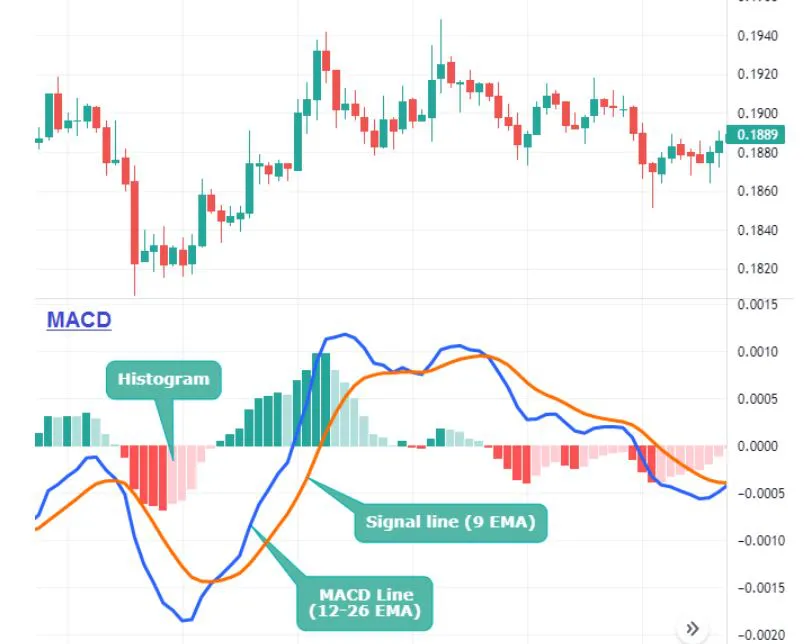
- The MACD line:It is the difference between two exponential moving averages (EMA) of different periods, usually 12 and 26.
- The Signal line: It is the 9-period moving average of the MACD line.
- The Central line: It is the zero reference line of MACD.
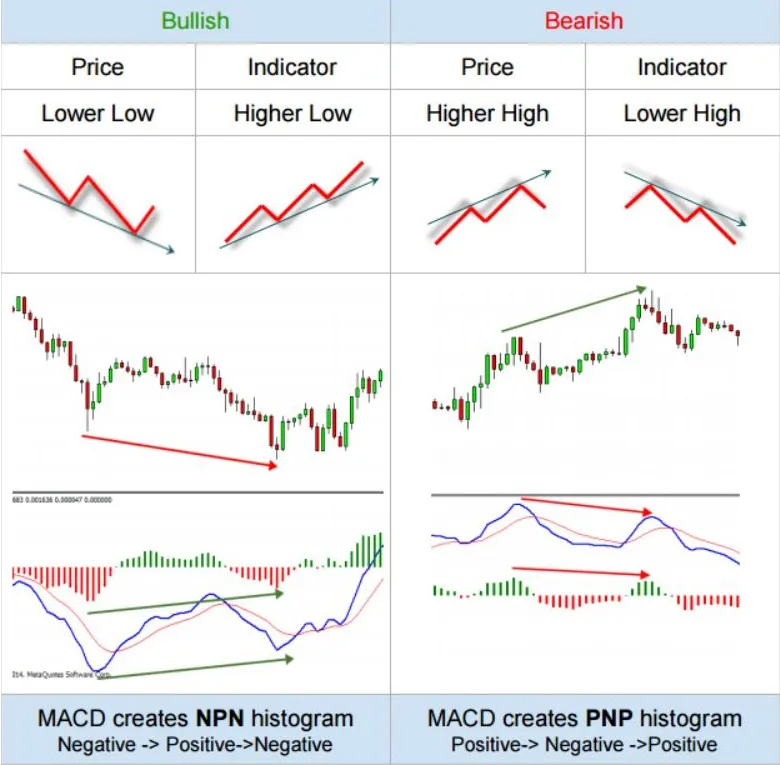
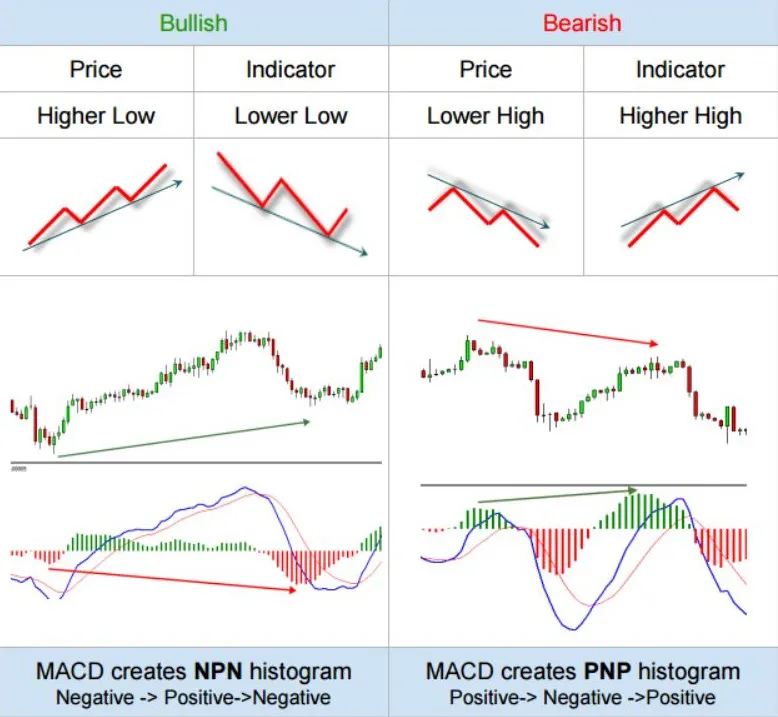
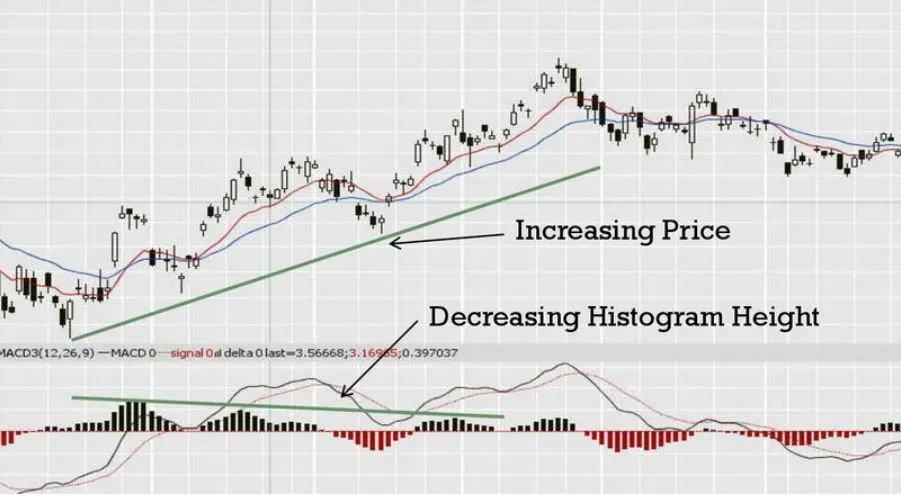
- The Histogram: It is the difference between the MACD line and the Signal line, and it provides a visual representation of the distance between the MACD line and the Signal line.
MACD
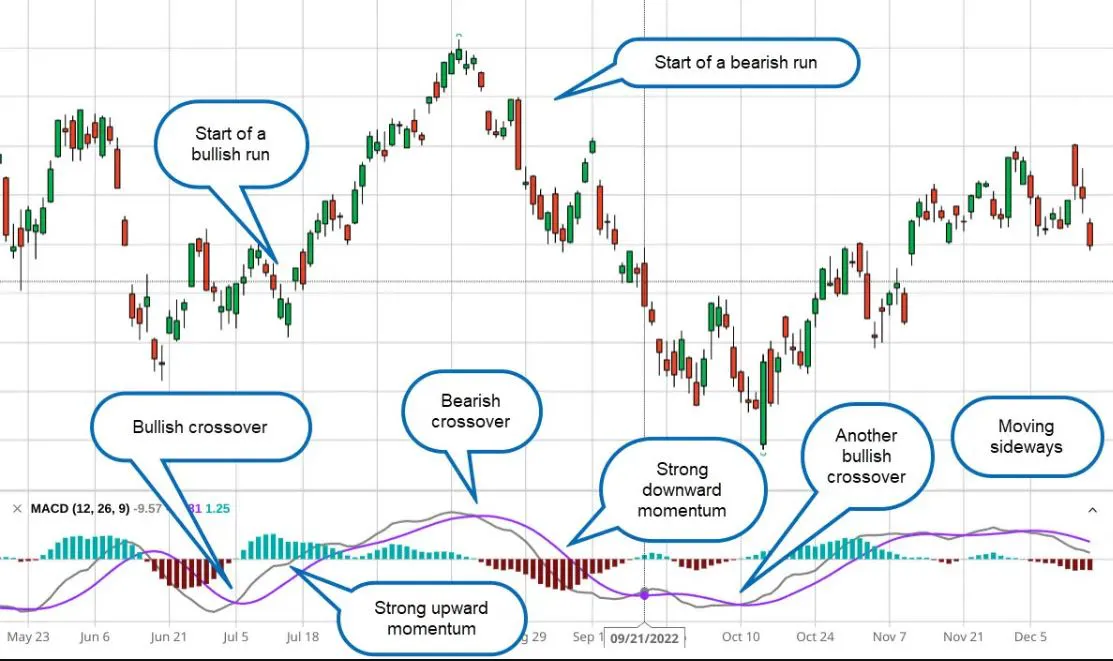
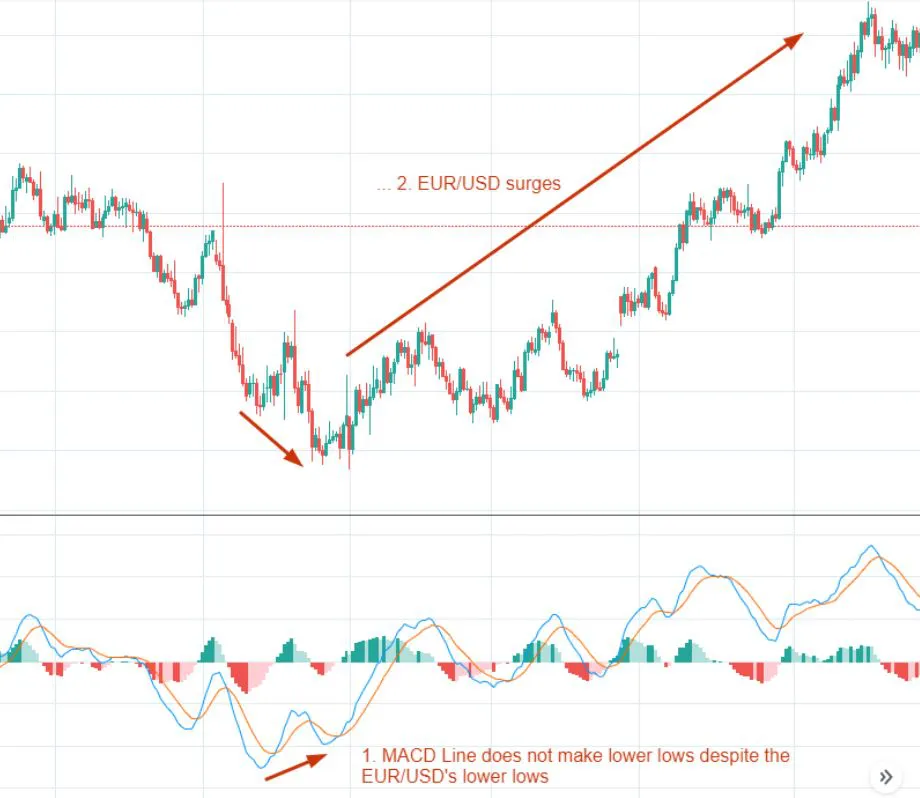
MACD, which stands for Moving Average Convergence Divergence, is a technical analysis indicator that helps traders identify trends and potential momentum shifts in the price of an asset.
MACD indicator line flows on positive and negative direction.
When the MACD line is positive, it indicates that the short-term moving average is above the long-term moving average, which suggests that the price is trending upwards.
When the MACD line is negative, it indicates that the short-term moving average is below the long-term moving average, which suggests that the price is trending downwards.