- 14-Period RSI - Traders use a 14-Period RSI based on the last 14 candles to calculate average gain or loss.
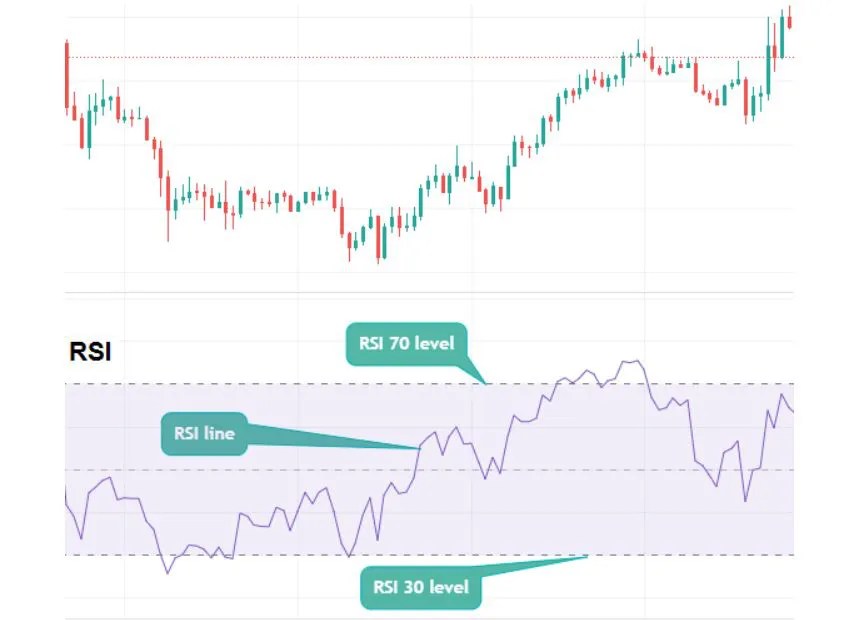
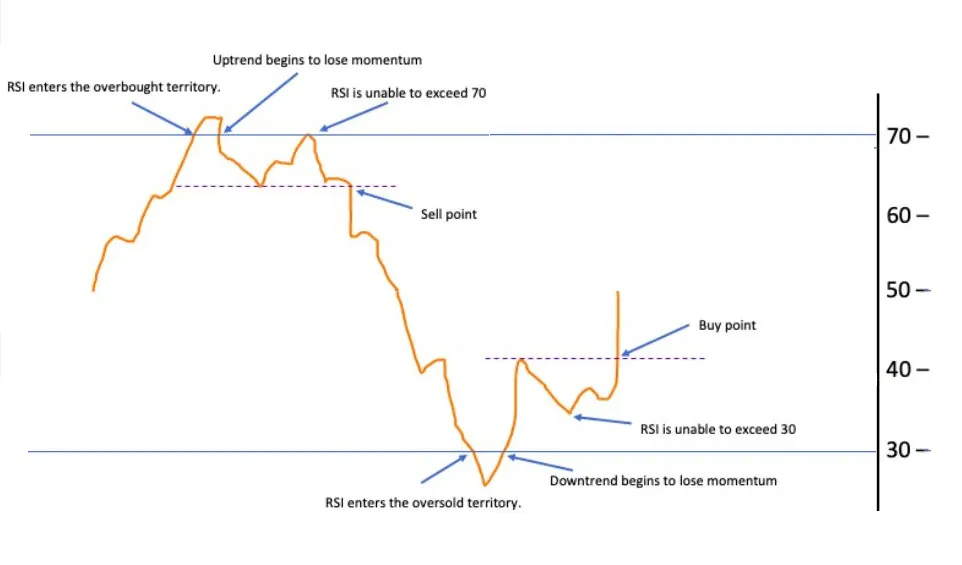
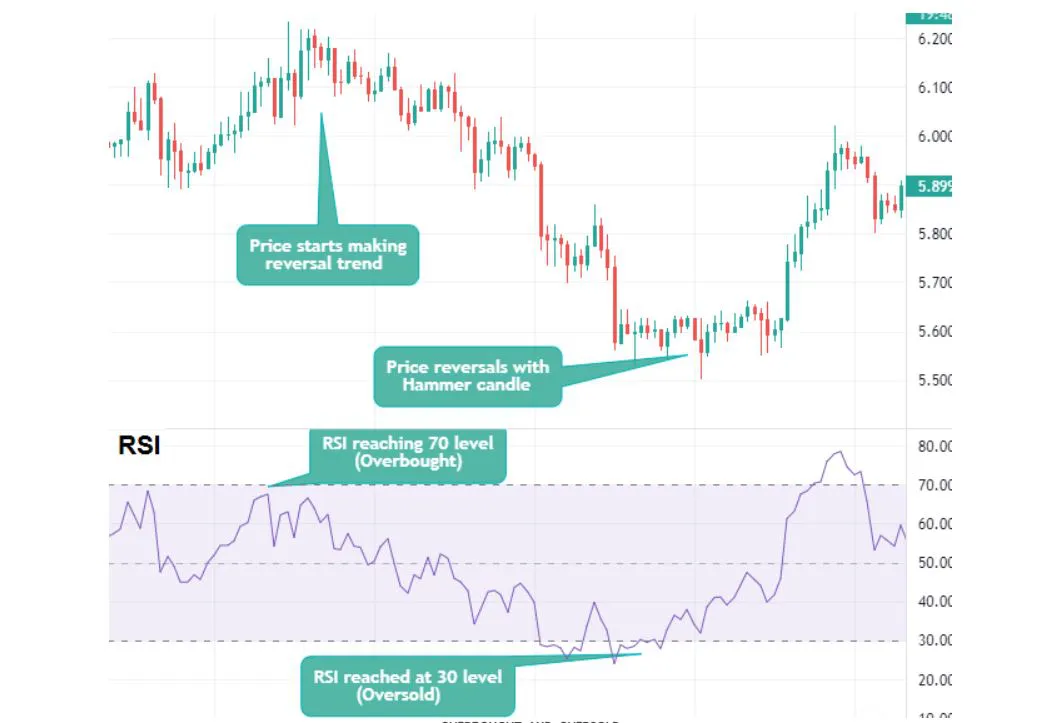
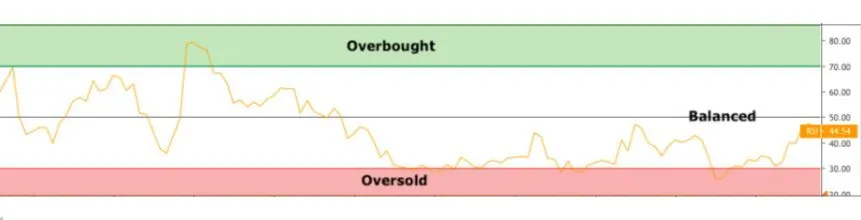
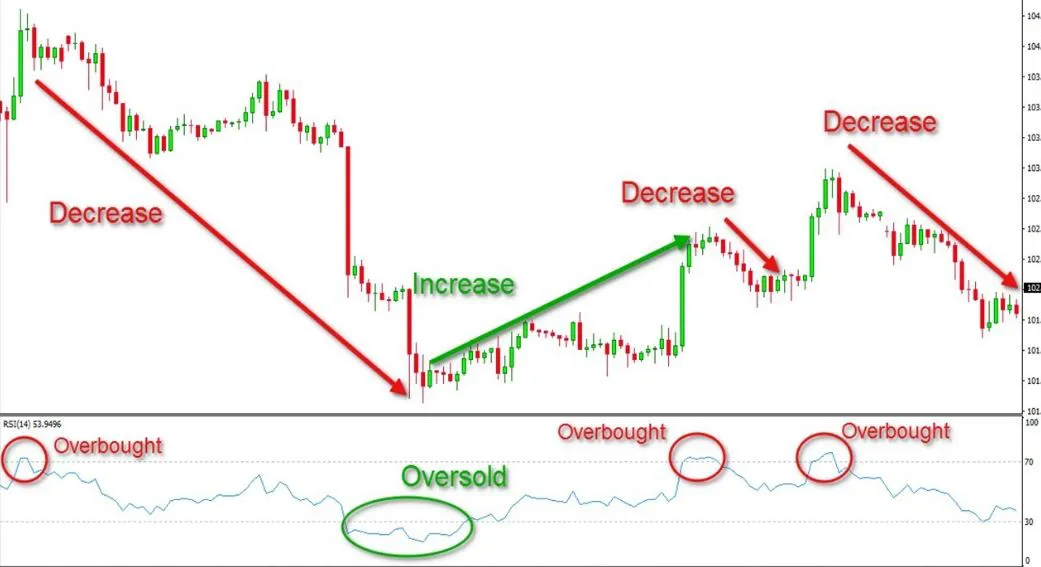
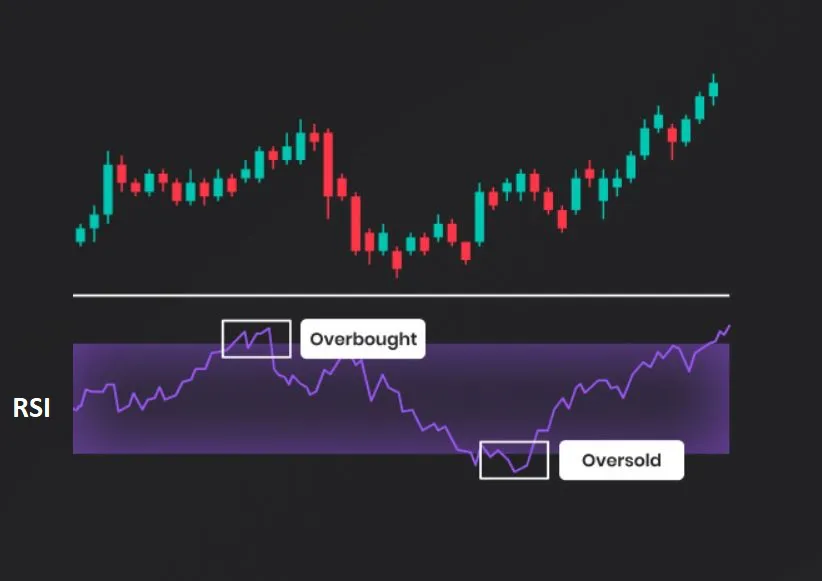
- 70 and 30 - Where 70 is overbought and 30 is oversold level
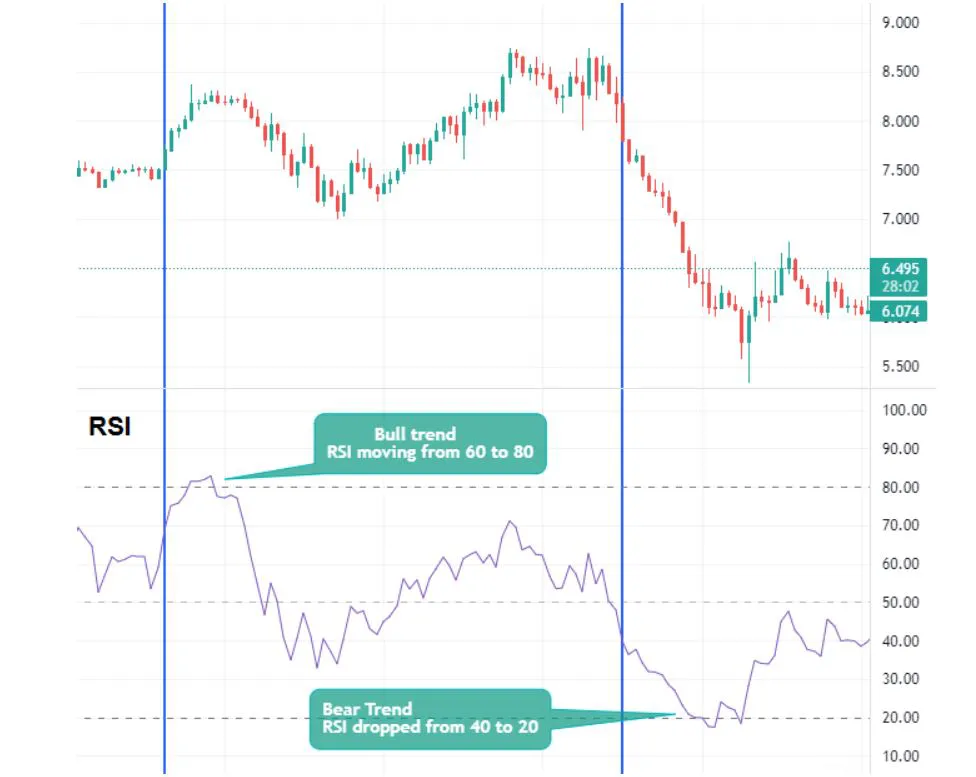
- 80 and 20 - Some traders use RSI levels of 80 and 20 to indicate overbought and oversold, respectively.
Relative Strength Index (RSI)
The RSI stands for Relative Strength Index, used by traders to measure how strong a price movement is. It looks at how much a price goes up compared to how much it goes down.
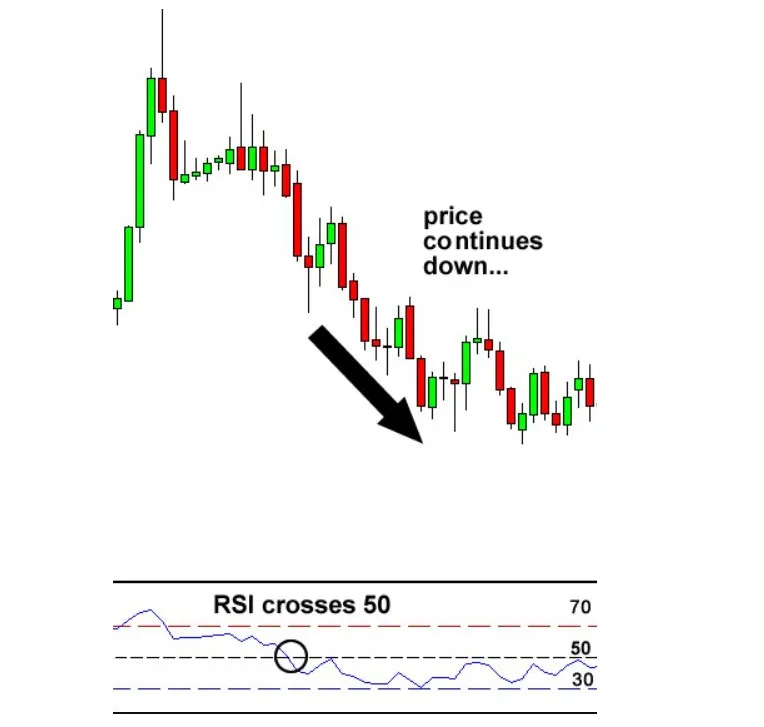
The RSI gives a number between 0 and 100, which helps traders figure out if the momentum is going up (bullish) or down (bearish).
If the price of an asset goes up quickly, the RSI number will be higher. If the price falls quickly, the RSI number will be lower.