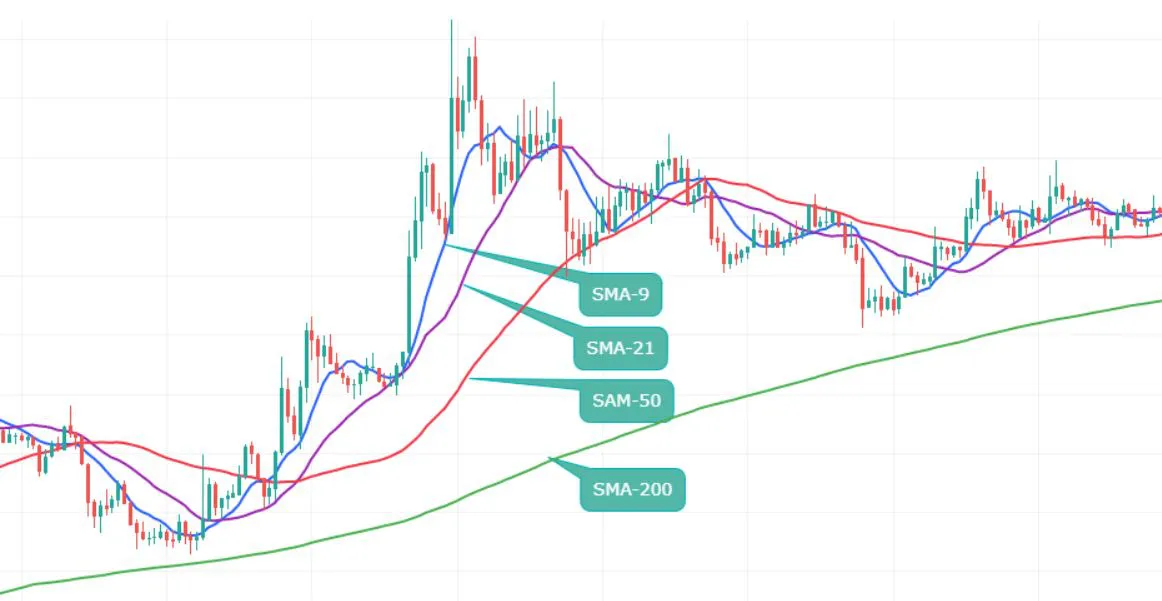
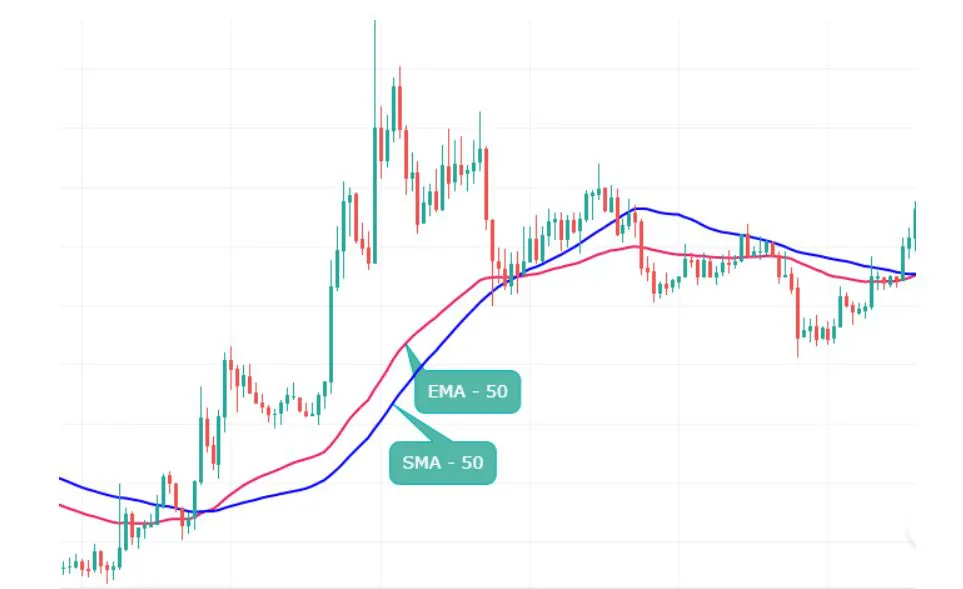
- SMA: Simple Moving Average
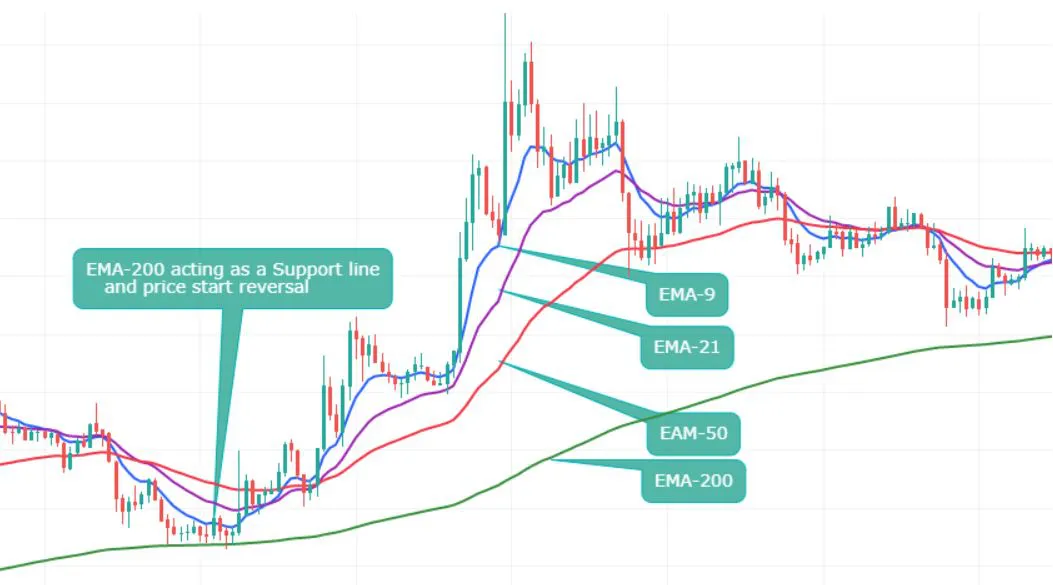
- EMA: Exponential Moving Average
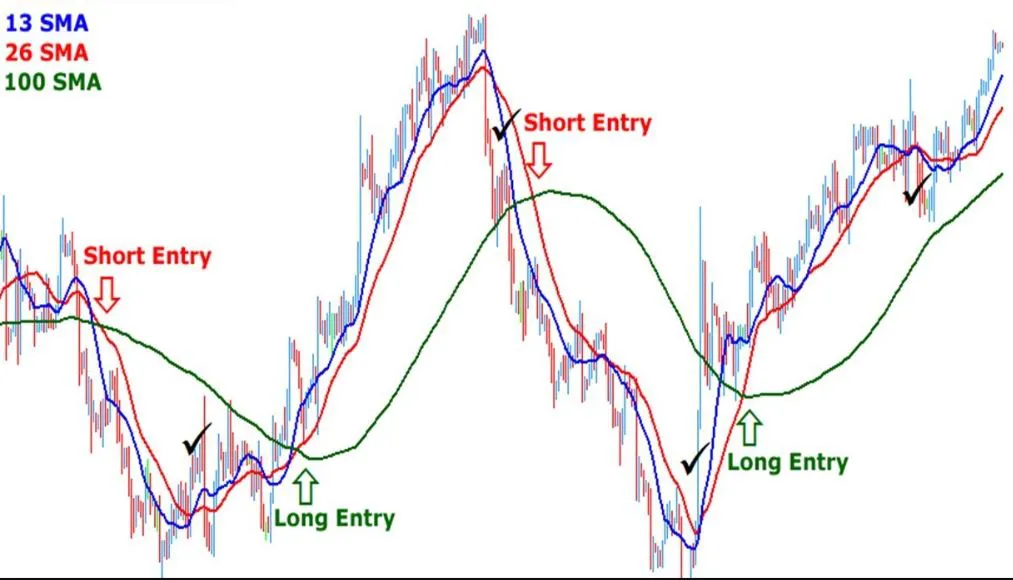
Moving Average
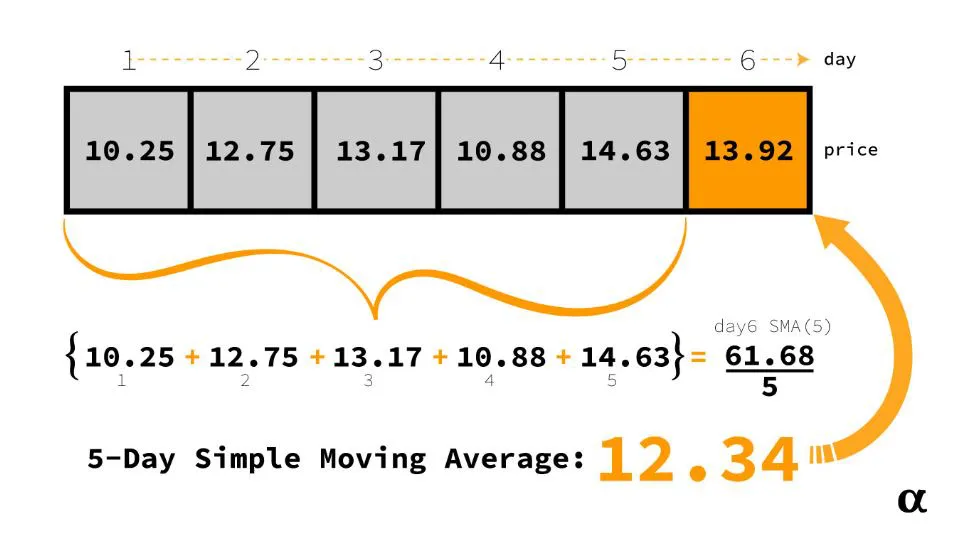
Moving averages are a way to figure out the average price of something over a certain amount of time in the past.
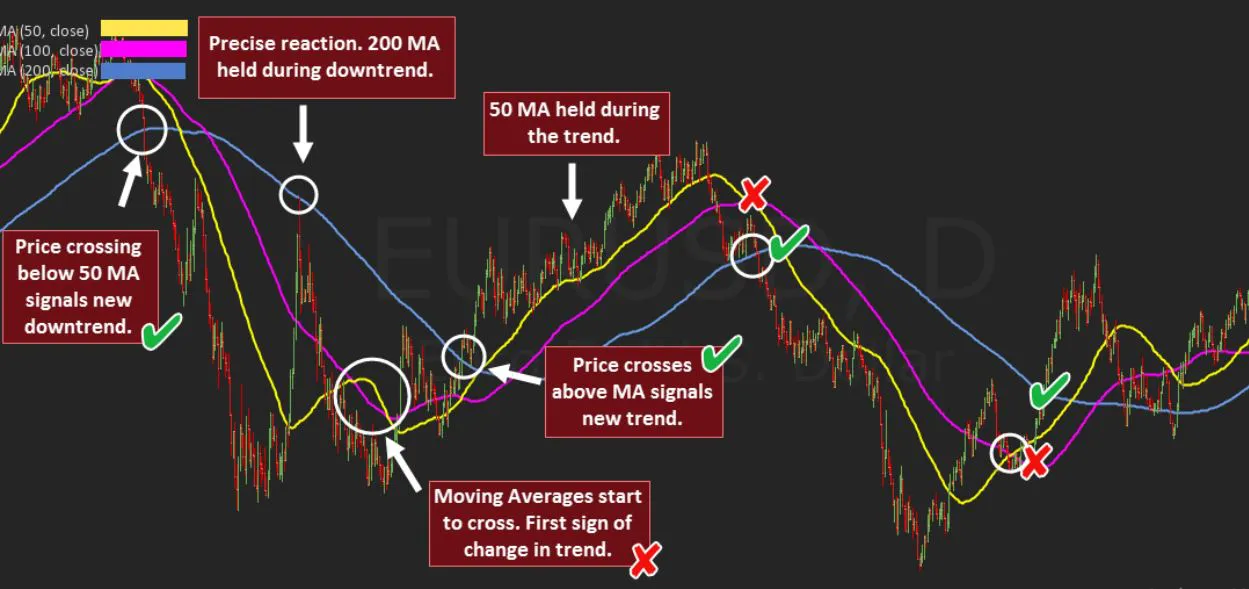
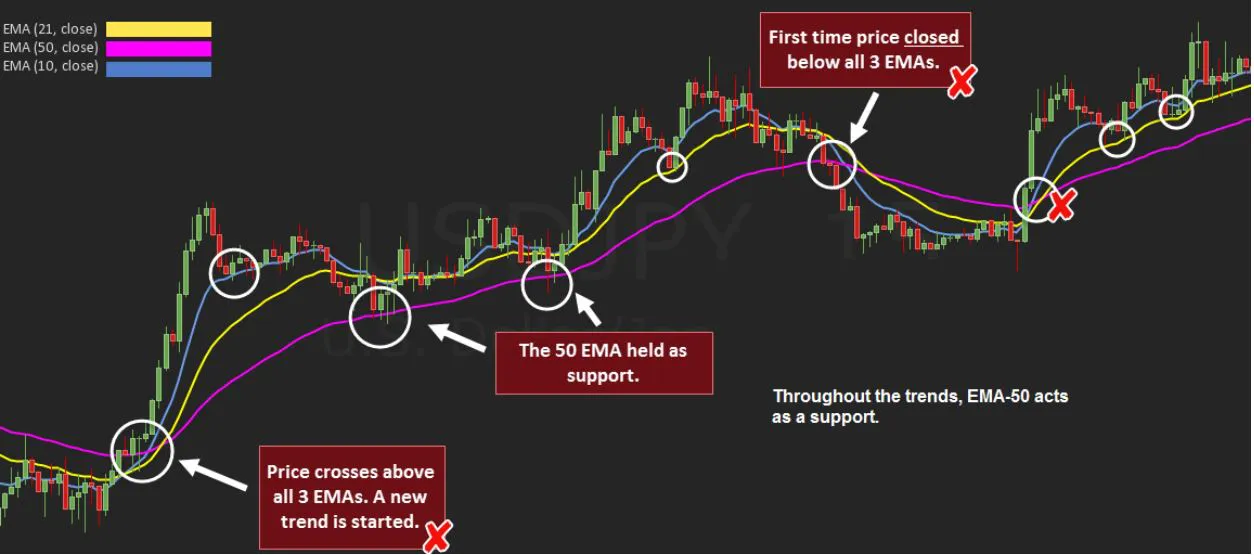
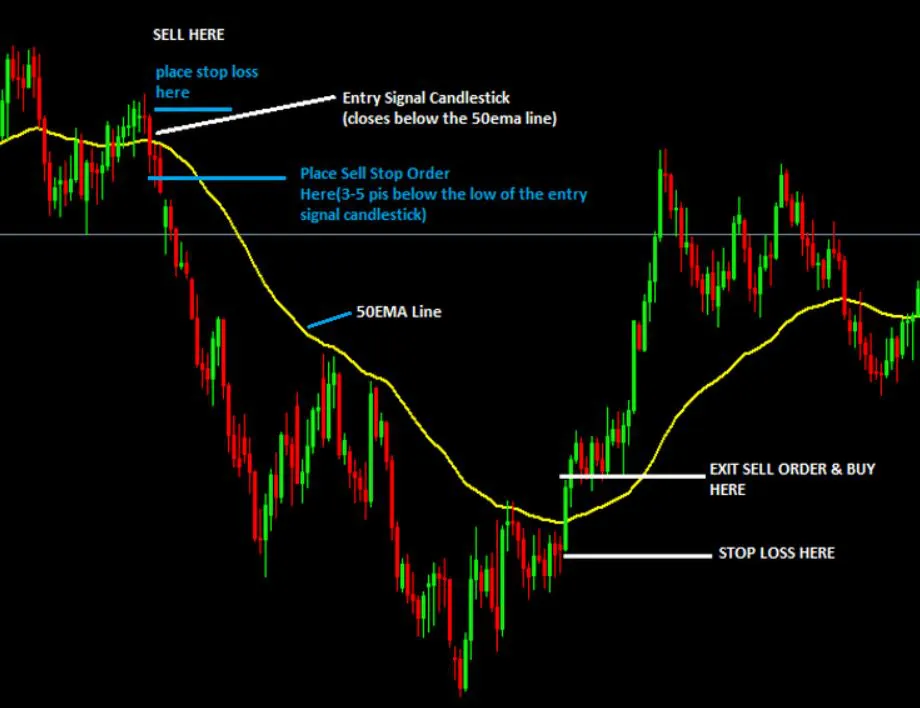
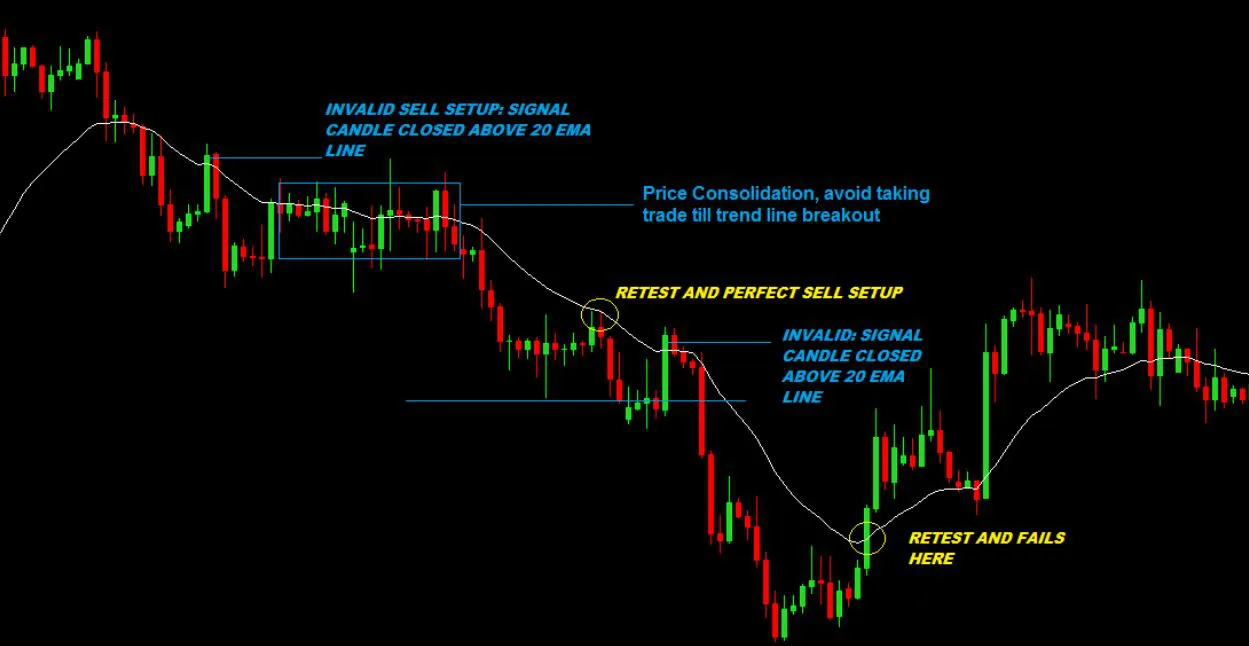
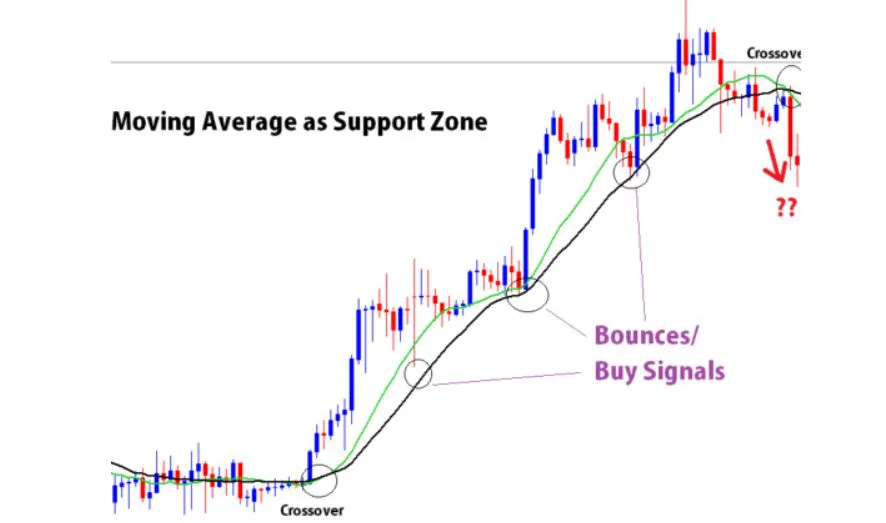
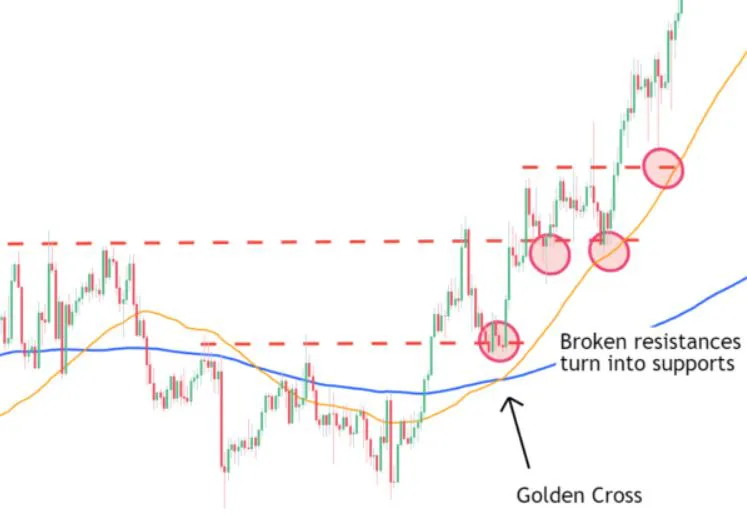
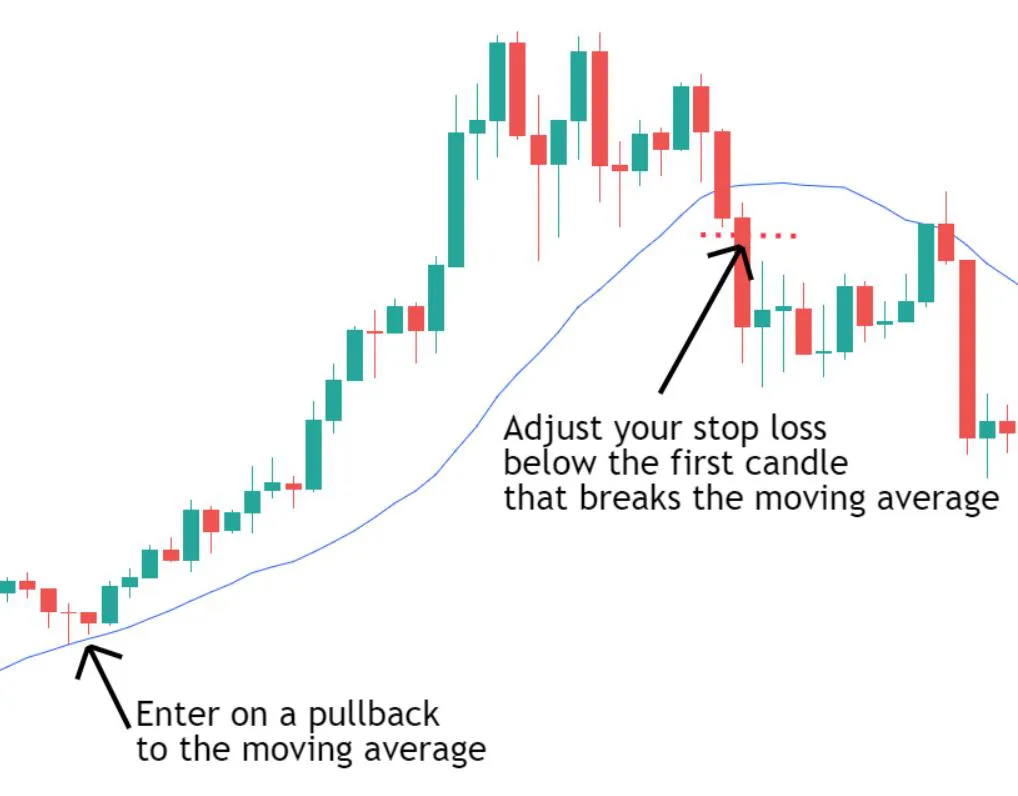
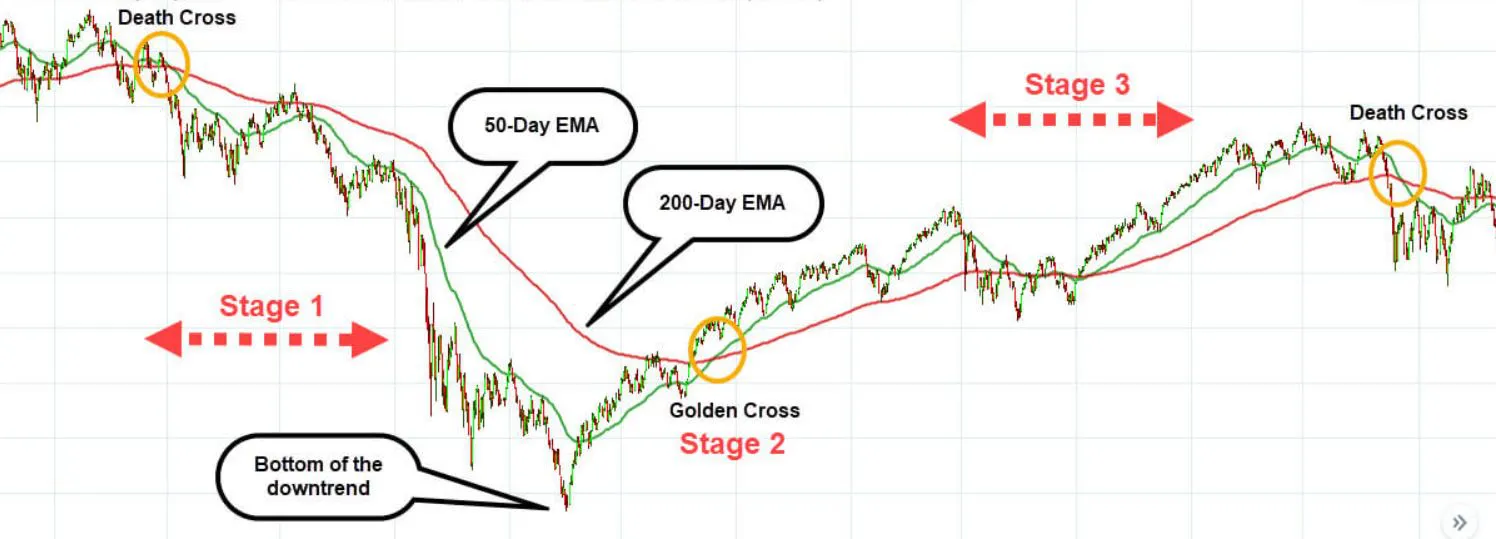
They can help predict where the price might go in the future by showing areas of support and resistance.
It reduces the price fluctuations or noise in the price chart so that the viewer can see the price movement smoothly without all the ups and downs.
A simple moving average (SMA) is just the average price of something over a certain period of time, example below shows the average value for 6 interval periods.
It's calculated by adding up all the prices in that period and then dividing by the number of days. Most commonly, people use the closing prices of each day to calculate the SMA.
EMA is another type of moving average, like SMA. But unlike SMA, EMA gives more importance to the recent price data points. This means it reacts more quickly to changes in price movements compared to SMA.
It's called as an "exponential" moving average because it gives more weight to the most recent data points.
Moving average periods:
How to use Moving Averages?
- There are multiple ways to use the moving averages. Below are the few examples. Please note that all the bellow examples applies to most of all different types of Moving averages(i.e SAM, EMA, TMA and others)
Moving average crossover strategy is a popular trading technique that uses the crossover of two different moving averages to determine entry and exit points in the market.
This strategy needs at least two moving averages to work.
The two most commonly used moving averages are the 50-period moving average and the 200-period moving average.
Few Traders use below strategy depending on their experience and skill
The Golden Cross and the Death Cross are two popular strategies that use moving averages to identify potential changes in market trends.
A Golden Cross occurs when a short-term moving average, such as the 50-day MA, crosses above a long-term moving average, such as the 200-day MA. This is considered a bullish signal, indicating a potential uptrend in the market.
A Death Crossoccurs when a short-term moving average, such as the 50-day MA, crosses below a long-term moving average, such as the 200-day MA. This is considered a bearish signal, indicating a potential downtrend in the market.
As we known that Support and resistance can be identified using horizontal lines, diagonal lines, or trend lines. Similarly Moving Averages also acts as Dynamic support and resistance.
Dynamic support and resistance levels refer to levels that constantly change based on the current price movement. When the price of a stock falls to the moving average and touches it or breakouts, traders can consider buying or selling, but they shouldn't do so every time it happens.
The example shown below demonstrates this concept.