Support and Resistance

To become a pro trader, if they have highly knowledge on technical analysis tools like RSI, candlestick patterns, Support and Resistance levels and stable Trading psychology.

All the technical indicators that we have today are derivatives of price and cannot give you more meaningful information than price alone.

In order to read the price information correctly, we should understand the concept of support and resistance.

We can find some levels from where the direction of the market starts to reverse its trend or stall its momentum. Those price levels are known as Support and Resistance levels.

  1. Support level

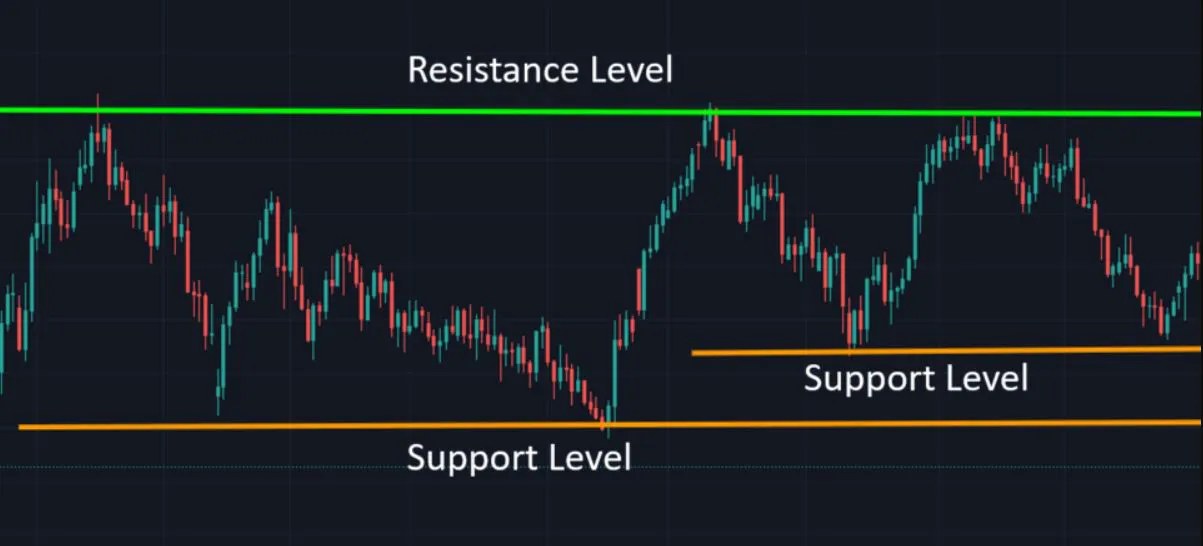
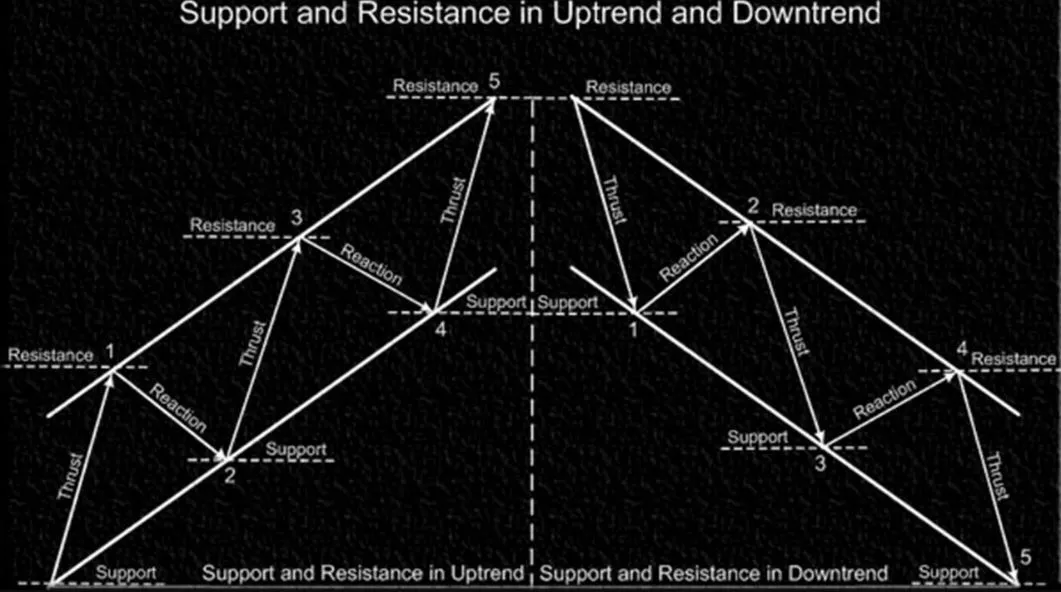
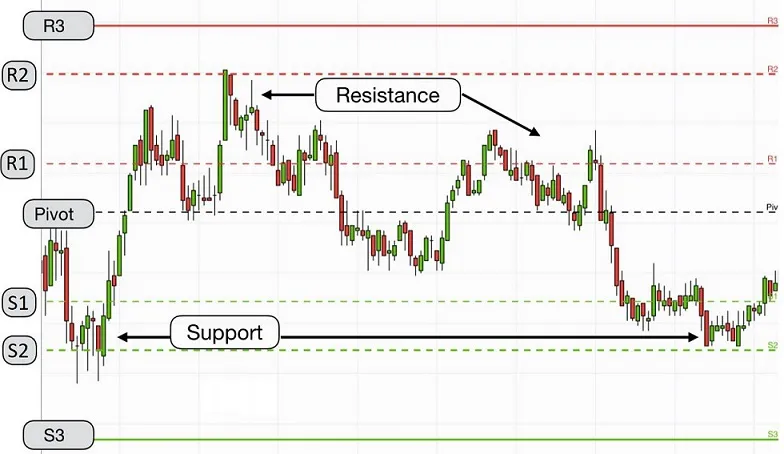
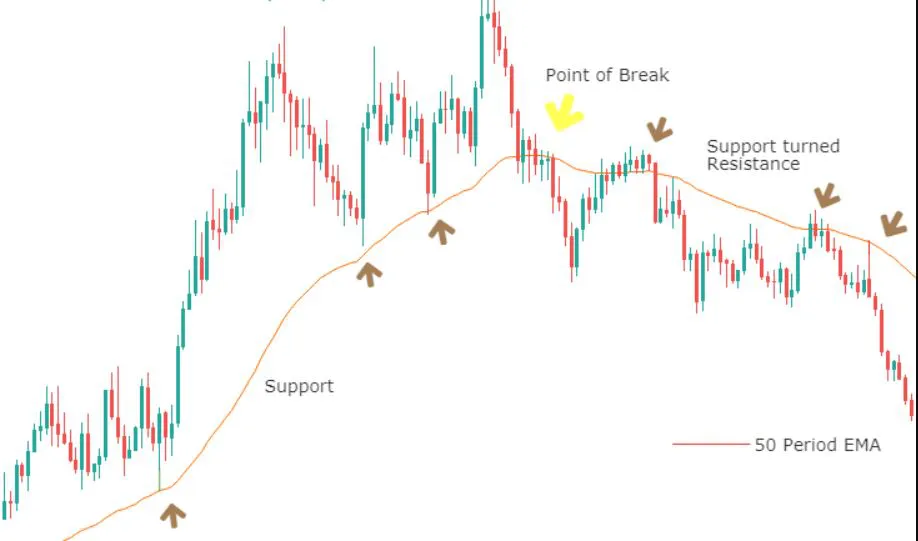
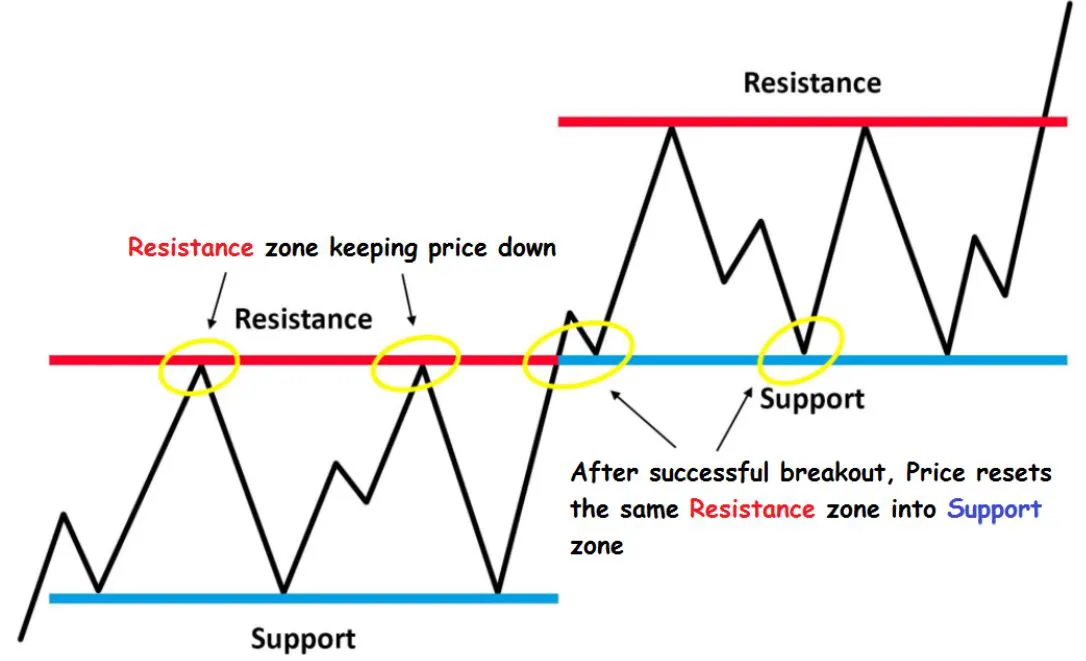
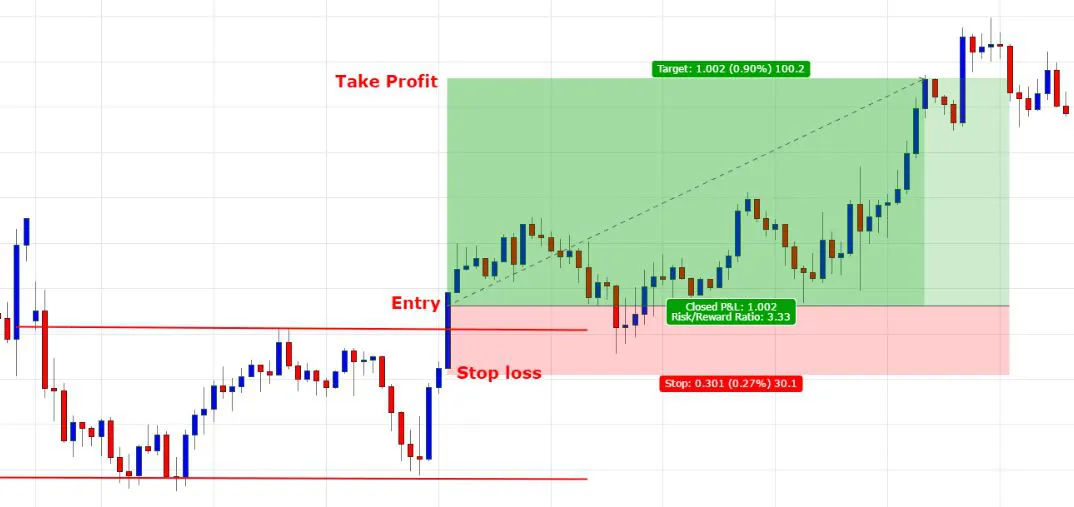
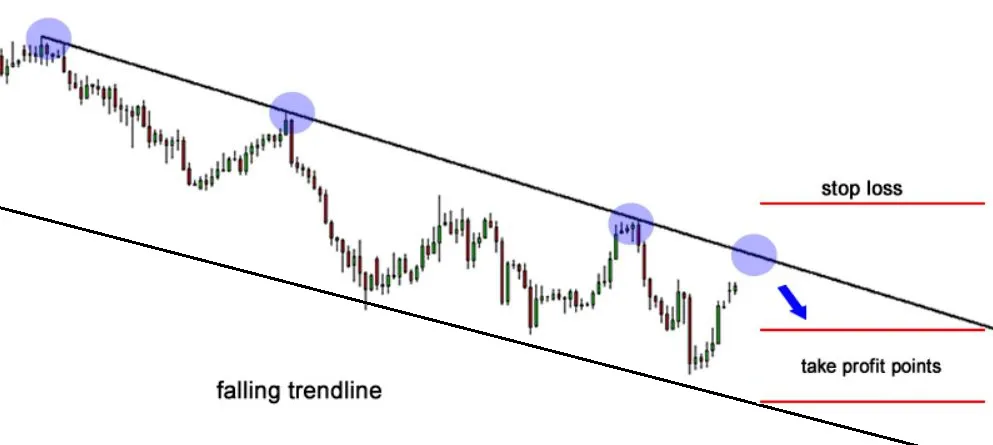
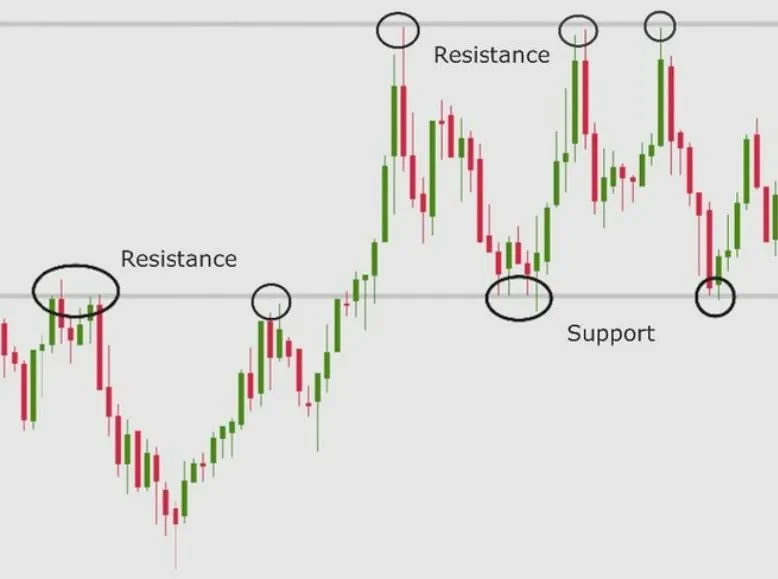
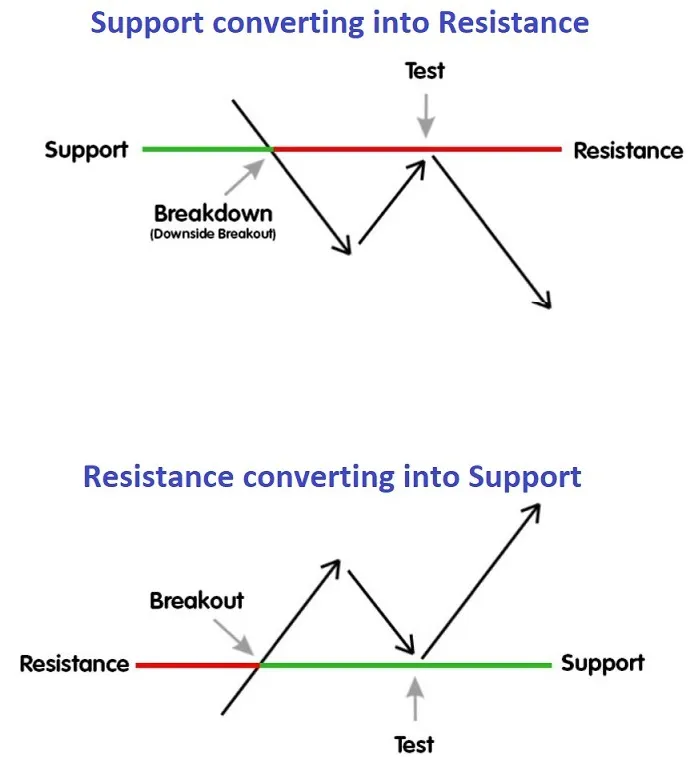
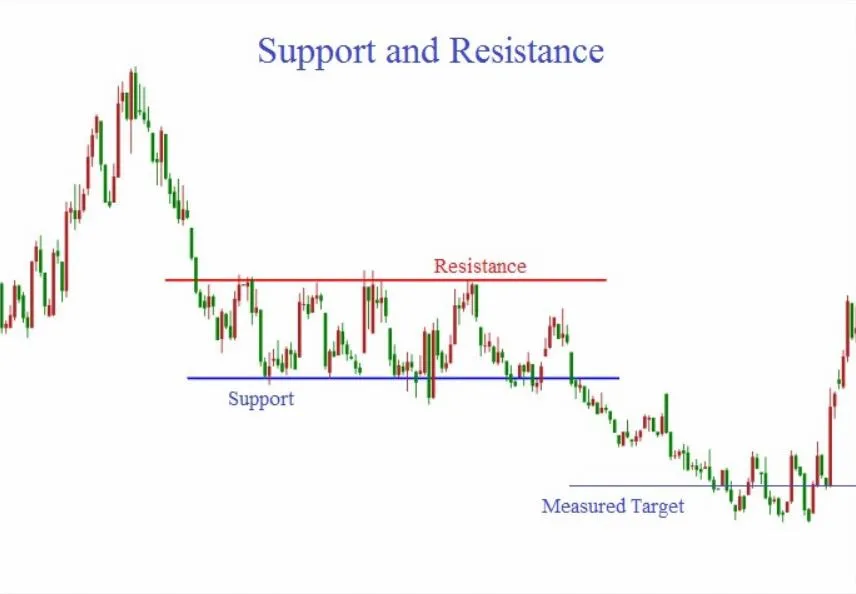
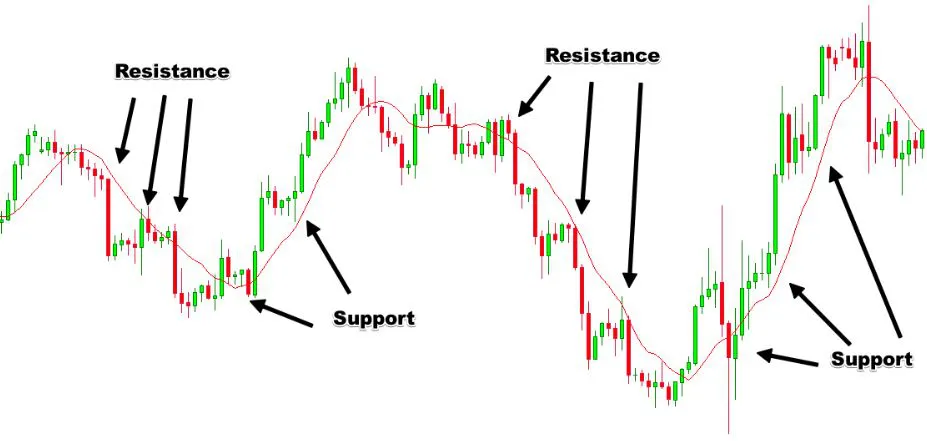
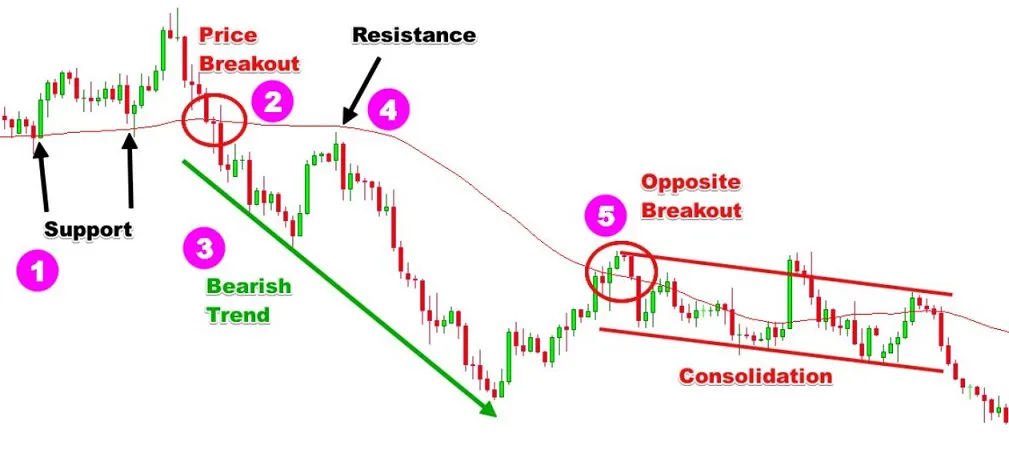
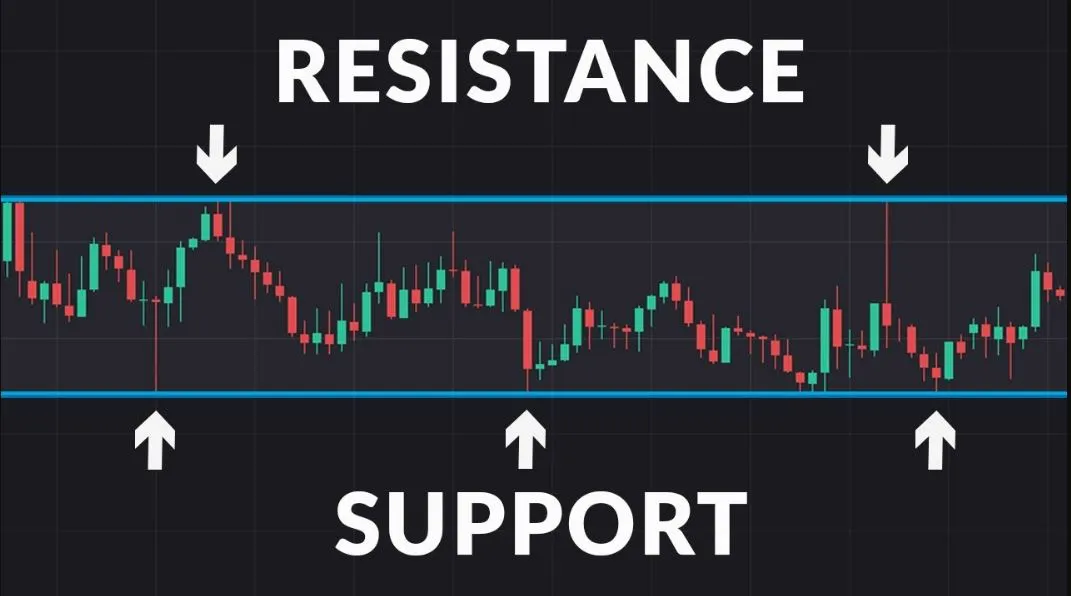
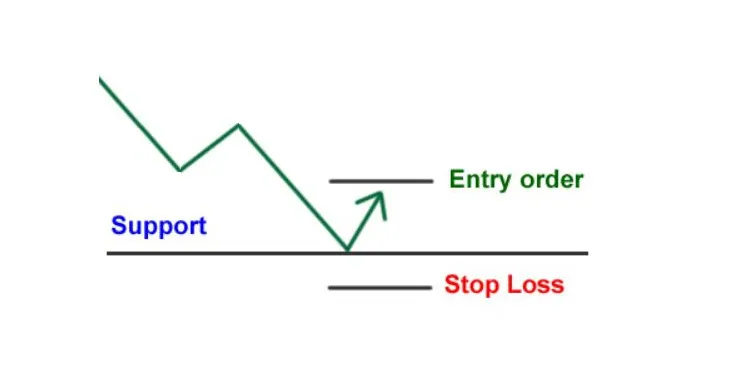
    • Support is a level in the price of an asset where there's a lot of buying activity that prevents the price from dropping further.
    • Traders often see support as a good place to buy because the risk of further losses is relatively low.
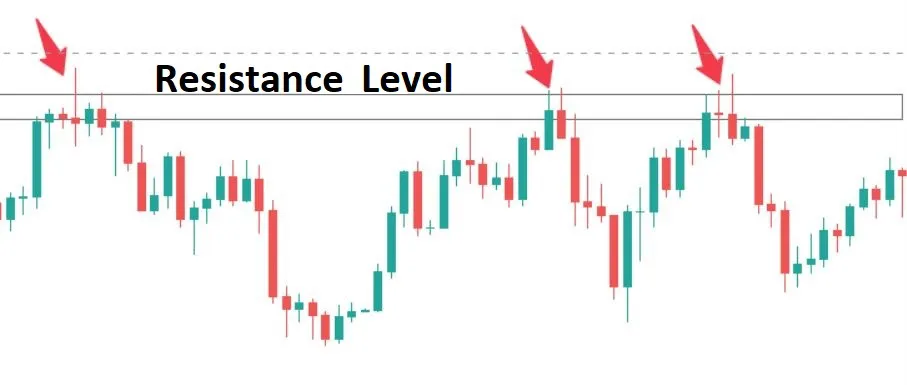
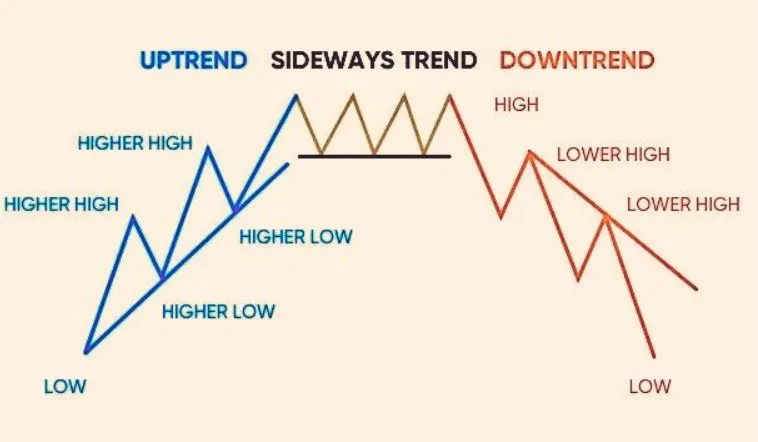
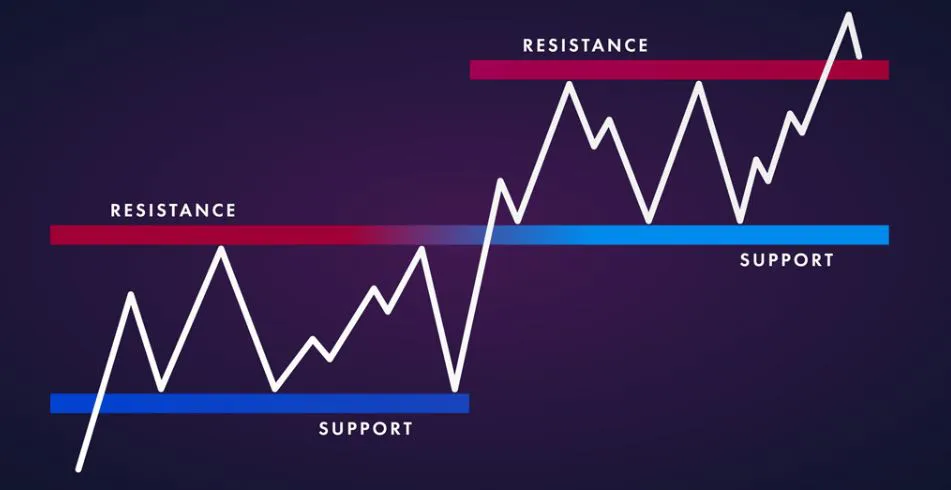
    • The more times the price has been supported at a certain level in the past, the stronger that level is seen by traders.
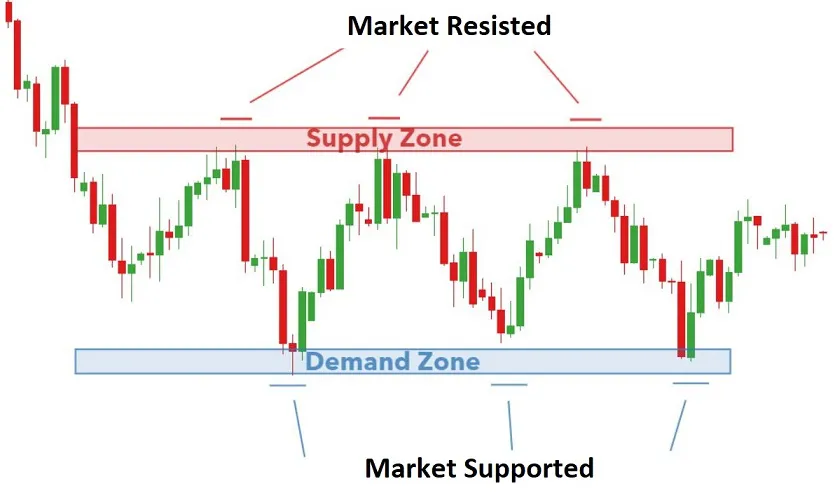
    • Support is a price area on a chart, where Supply is located
    • If the price breaks through a strong support level, traders may interpret this as a bearish signal, indicating that the asset may continue to fall.
  2. Resistance level

    • Resistance is the opposite of support. It's a level in the price of an asset where there's a lot of selling activity that prevents the price from going up further.
    • Traders often see resistance as a good place to sell because the risk of further losses is relatively low.
    • The more times the price has been resisted at a certain level in the past, the stronger that level is seen by traders.
    • Resistance is a price area on a chart, where Demand is located
    • If the price breaks through a strong resistance level, traders may interpret this as a bullish signal, indicating that the asset may continue to rise.

How to identify Support and Resistance levels?
- Below are few different methods to identify support or resistance level.

  1. Trend Zone

    • By analyzing the trend reversal points in the price chart of a stock, you can draw a combined trend line over those points.
    • These trend lines acts as support and resistance levels.
  2. Demand and Supply zones

    • When you look at a price chart, you may notice certain areas where the price has either bounced off or struggled to break through in the past. These areas are known as support and resistance levels, respectively.
    • When the price approaches a support level, buyers may be willing to purchase the stock at that level, which creates demand and causes the price to bounce off that level.
    • When the price approaches a resistance level, sellers may be willing to sell the stock at that level, which creates supply and causes the price to struggle to break through that level.
  3. Higher high and lower lows

    • When a stock is in an uptrend, it will typically form a pattern of higher highs and higher lows.
    • Each new high is higher than the previous high, and each new low is also higher than the previous low.
    • These higher lows can be considered as potential support levels, as they indicate that buyers are willing to step in and purchase the stock at higher prices.

    • Similarly, when a stock is in a downtrend, it will typically form a pattern of lower highs and lower lows.
    • Each new high is lower than the previous high, and each new low is also lower than the previous low.
    • These lower highs can be considered as potential resistance levels, as they indicate that sellers are willing to sell the stock at lower prices.
  4. Pivot Points

    • Pivot levels uses multiple time frames to identify potential support and resistance levels in the market.
    • Traders use high and low points from multiple time-frame of charts as a reference to identify support and resistance levels.
    • To use the pivot level, traders typically start by identifying the most recent high and low points on a longer-term chart, such as a monthly or weekly chart. They then use these levels as a reference point to identify potential support and resistance levels on shorter-term charts, such as daily or hourly charts.
  5. Moving average

    • Moving averages are commonly used to identify support and resistance levels.
    • When the price is above the moving average, it may act as support, and when the price is below the moving average, it may act as resistance.
    • On other section of this app, you can see more detailed info on Moving averages.
  6. Fibonacci retracement

    • Fibonacci retracement are based on the idea that price movements tend to retrace a predictable portion of a previous move before continuing in the original direction.
    • Fibonacci retracement can be used to identify potential support and resistance levels based on the key Fibonacci levels of 38.2%, 50%, and 61.8%.
    • On other section of this app, you can see more detailed info on Fibonacci retracement.


Points to remember about Support and Resistance levels:


How to take position in the market?
- Depending on trading psychology and individual risk, some Traders follow below rules to enter into positions.

  1. Entry

    Entering a Long Position:

    • Identify trend reversal points and draw trendline forming support and resistance
    • Traders can look for a support level to buy at when the price bounces off that level, indicating that buyers are stepping in and the price may be about to rise.
    • Alternatively, traders can enter a long position when the price breaks above a resistance level, which may indicate a shift in market sentiment and the potential for an upward trend.

    Entering a Short Position:

    • Traders can look for a resistance level to sell at when the price bounces off that level, indicating that sellers are stepping in and the price may be about to drop.
    • Alternatively, traders can enter a short position when the price breaks below a support level, which may indicate a shift in market sentiment and the potential for a downward trend.
  2. Target

    • Targets for long positions can be set at the next resistance level or a price level where the trader expects the market to encounter selling pressure.
    • Targets for short positions can be set at the next support level or a price level where the trader expects the market to encounter buying pressure.
    • Use other technical indicators to set target.
  3. Stop Loss

    • A stop-loss order can be placed below a support level for long positions or above a resistance level for short positions to protect against significant losses if the market moves against the trader.
    • Traders may also use a trailing stop-loss, which is adjusted as the market moves in their favor, to capture gains and limit losses.
  • Trend points will not be in same level or zones, so support and resistance lines should be adjusted to reach those points.
  • Fake-outs can occur most of the time.
  • Example-1 : Market reversing its direction at support and resistance levels.


    Example-2 : Support and resistance levels interchange their roles as they break, leading to market reversals and changes in price direction.


    Example-3 : Formation of Support and resistance level. If you look carefully, we can observe Bearish Flag Pattern Too.


    Example-4 : Moving Average line acting as Support and resistance for price.


    Example-5 : Market goes Bearish after it breaks Moving average support line


    Example-6 : Fibonacci retracement with Entry, StopLoss and Target


    Example-7 : Moving Average line acting as Support line


    Example-8 : Simple Entry, Target and Stoploss


    Example-9 : Simple Entry, Target and Stoploss with confirmation of MACD divergence


    Example-10 : Support and resistance line in downward Trend line


    Example-11 : Trying to take trade at High Resistance Zone.


    Share the App - Share Alpha