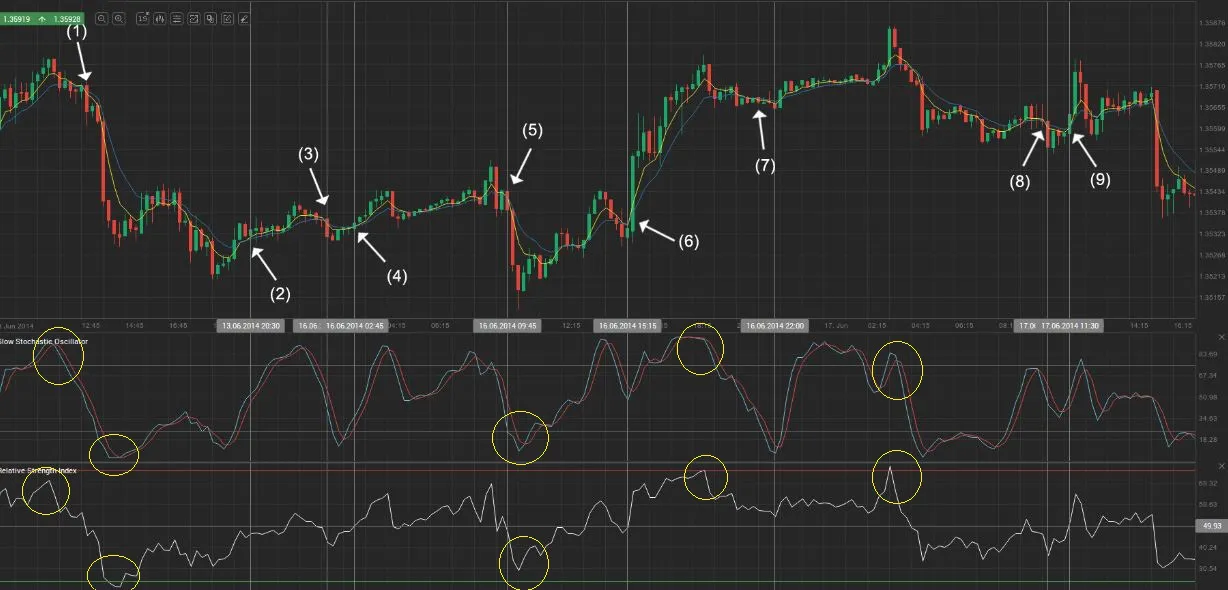
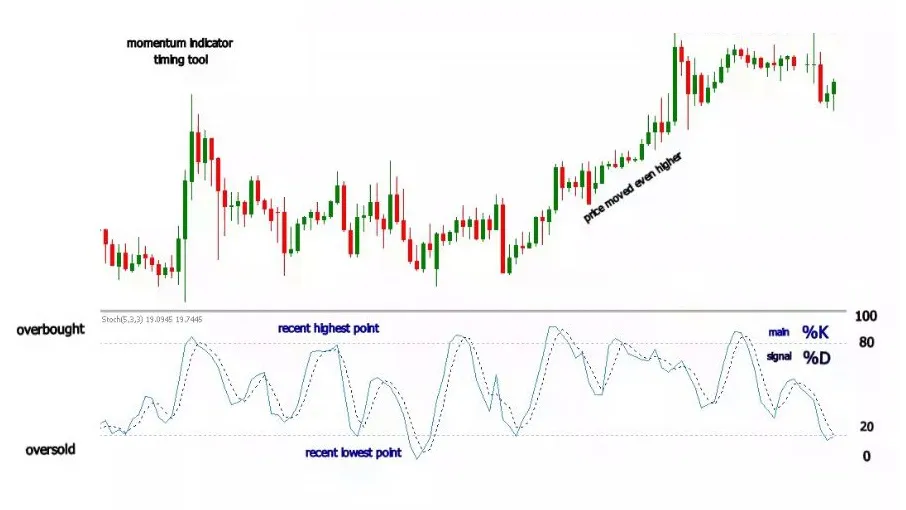
- Oscillator: Like RSI (Relative Strength Index) indicator, the stochastic indicator also uses a range of 0 to 100.
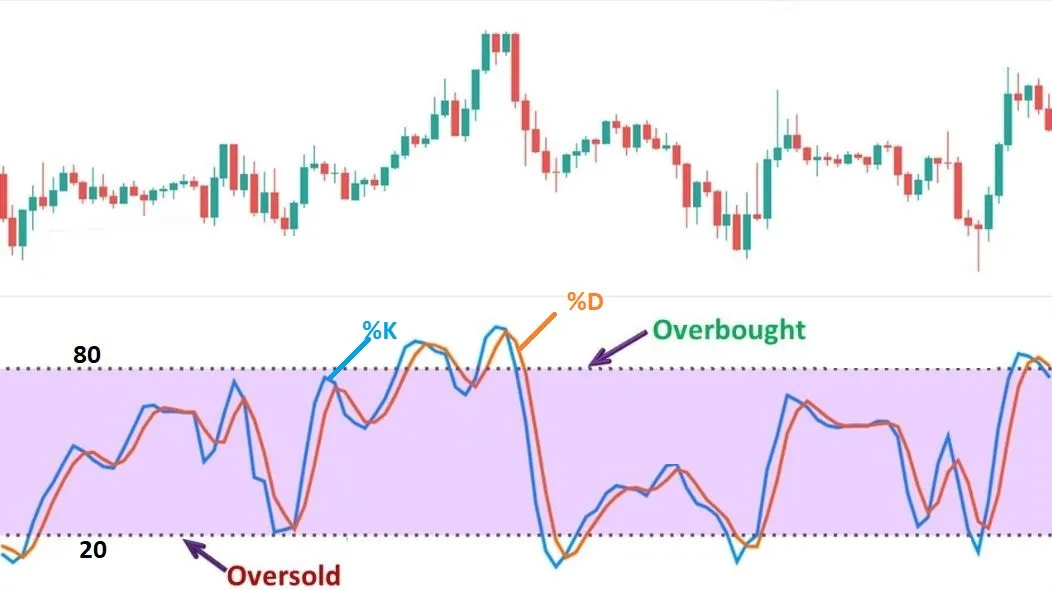
- %K & %D : The stochastic indicator compares the closing price of an asset to its price range over a specific period of time. Usually %K & %D are set to value "3" and time to "14". It consists of two lines: %K and %D.
- Formula: The %K line represents the current closing price relative to the highest high and lowest low of a specified lookback period. It is calculated using the following formula:
- The %D line is a moving average of %K and is typically calculated using a 3-period simple moving average (SMA) of %K
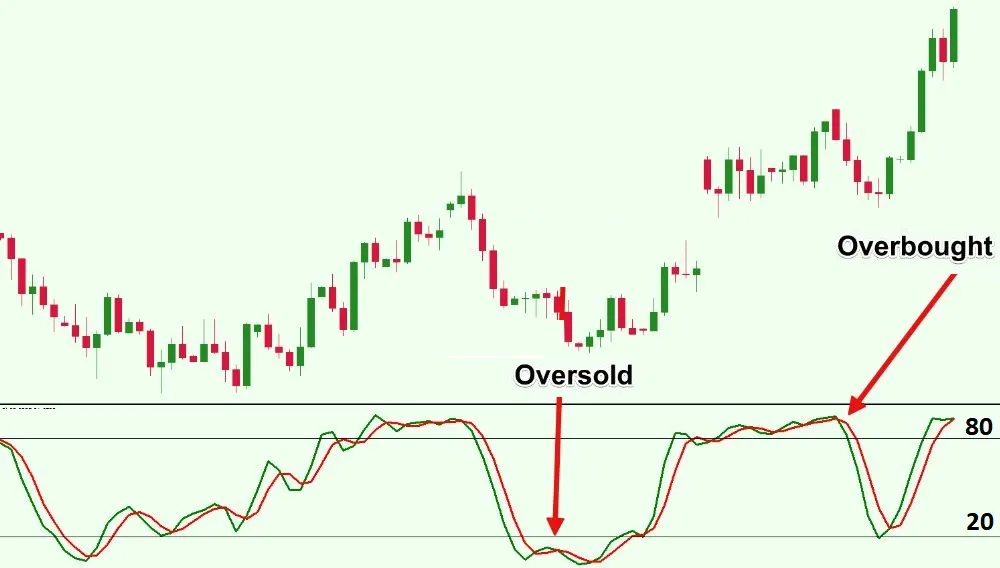
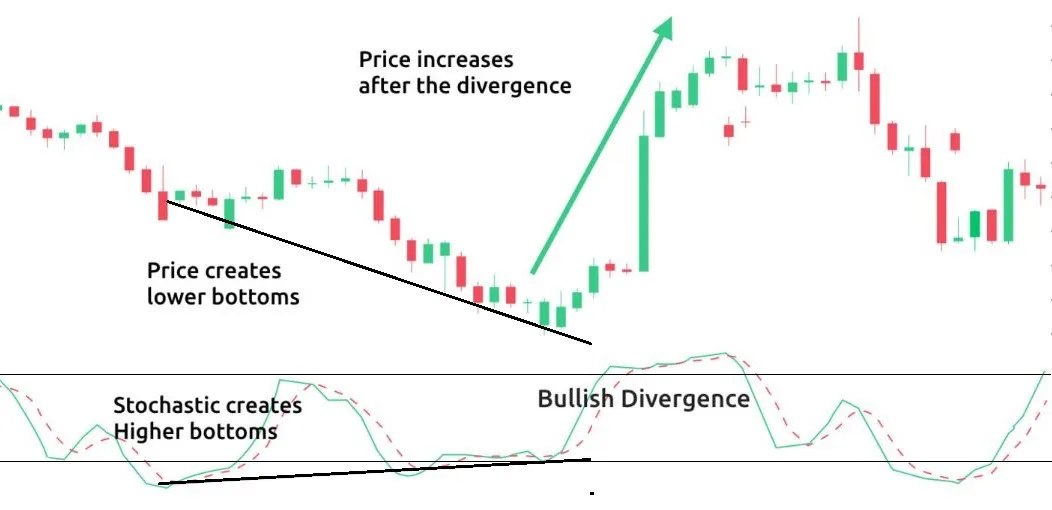
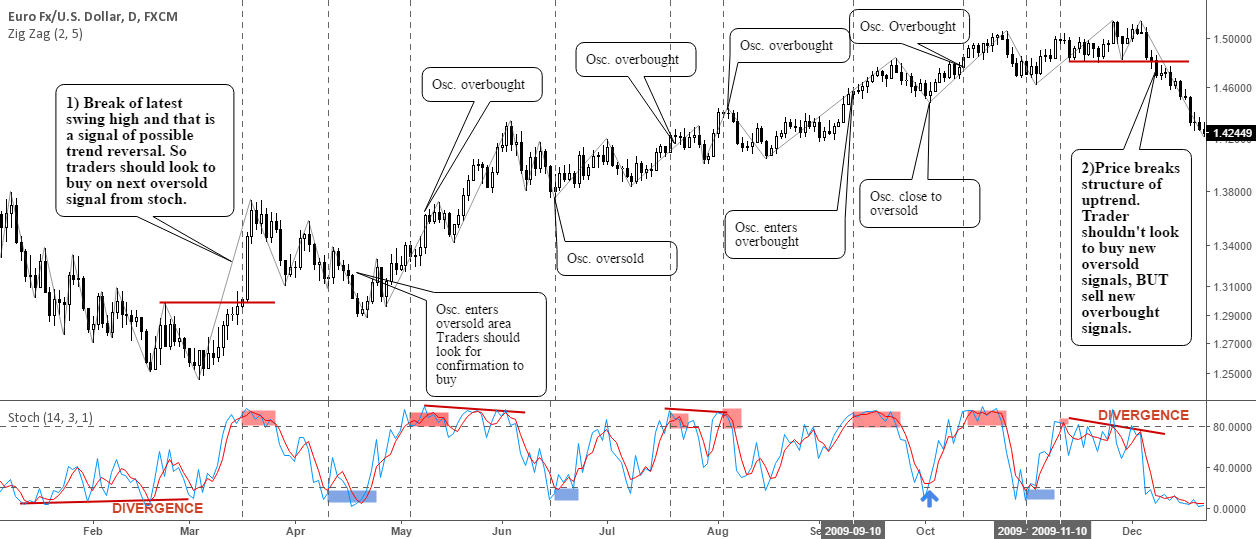
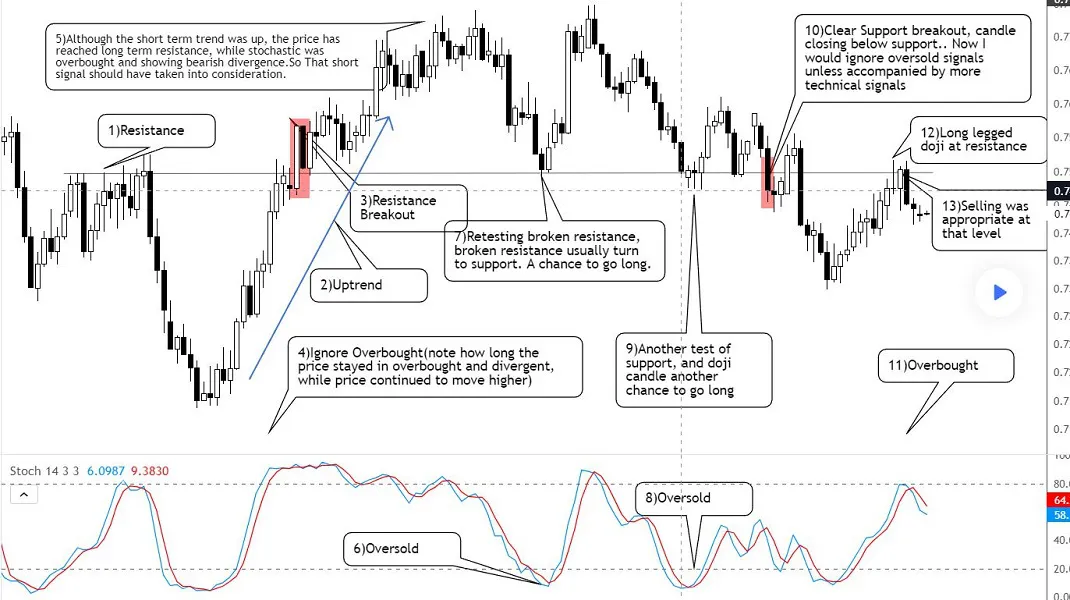
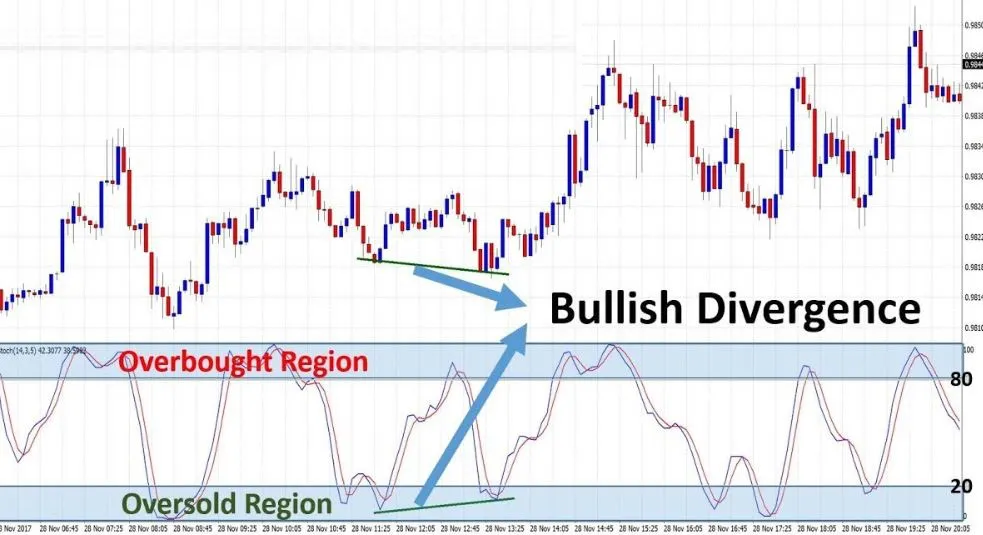
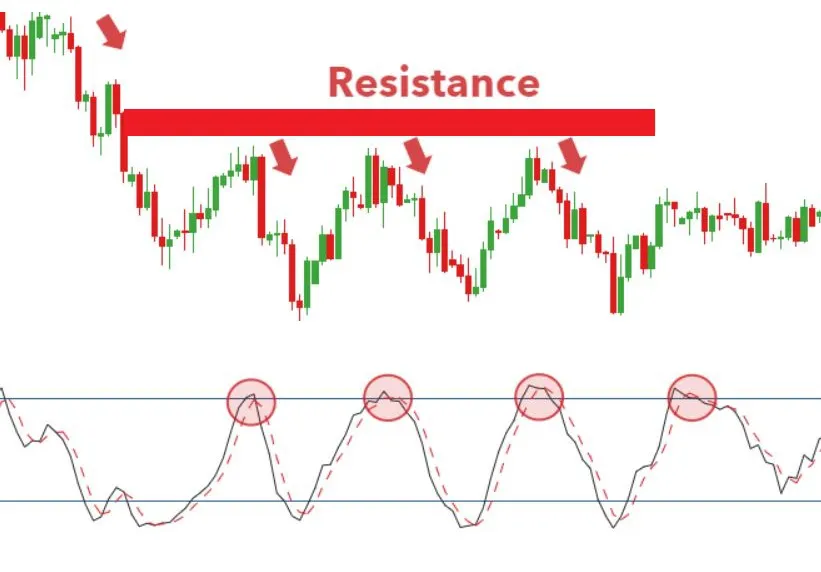
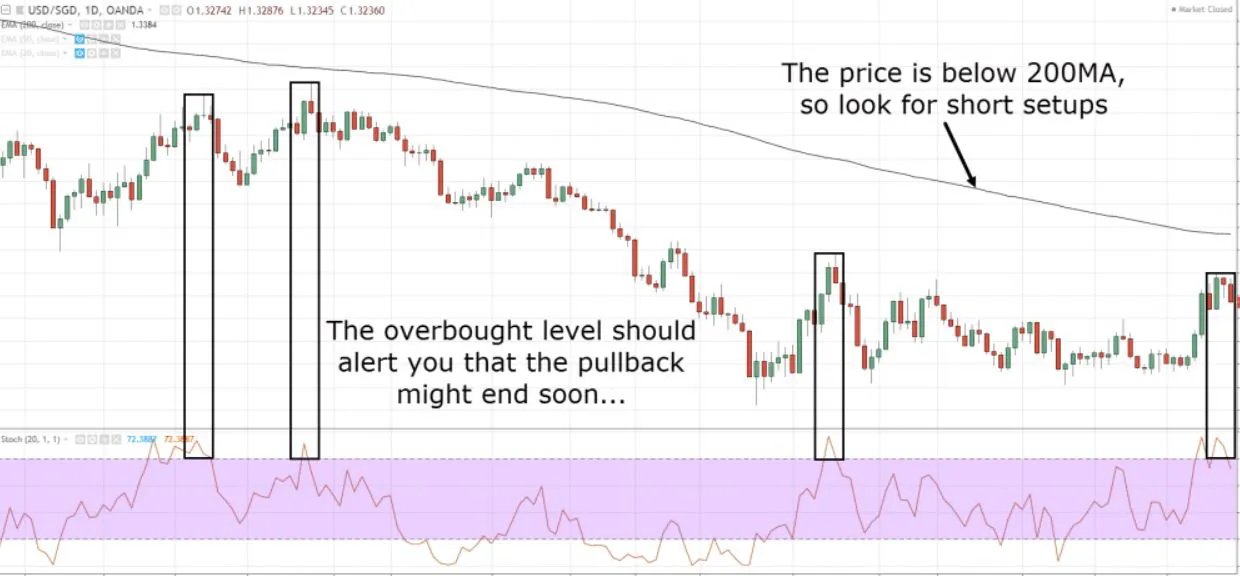
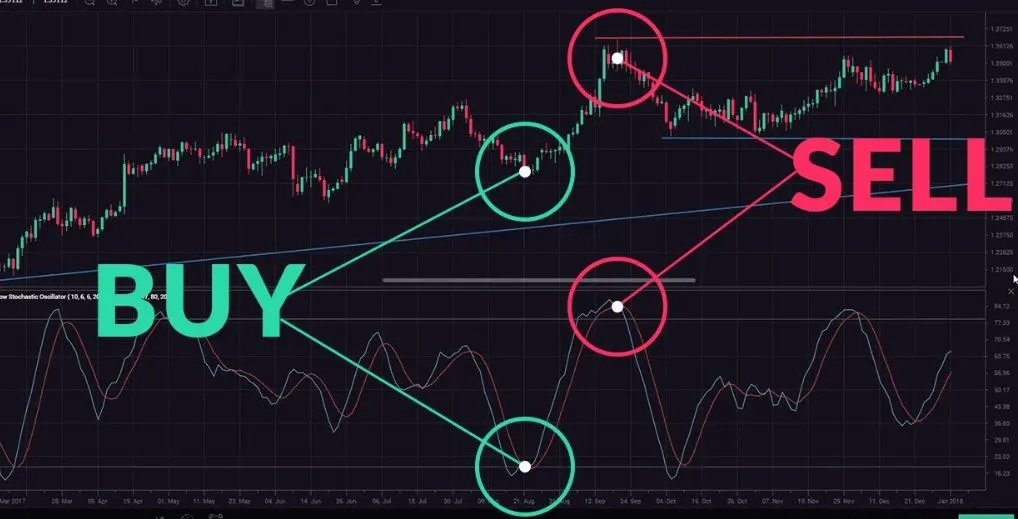
- Overbought : Overbought stocks are typically identified when the stochastic oscillator %K value is above 80. In a stochastic oscillator, when a stock is overbought, it means that the stock is trading higher than its usual range. This can be a signal for traders to consider selling the stock.
- Oversold : Oversold stocks are typically identified when the stochastic oscillator %K value is below 20. In a stochastic oscillator, an oversold stock means it is trading below its normal range. Traders need to be cautious about buying oversold stocks.
%K = (Current Close - Lowest Low) / (Highest High - Lowest Low) * 100