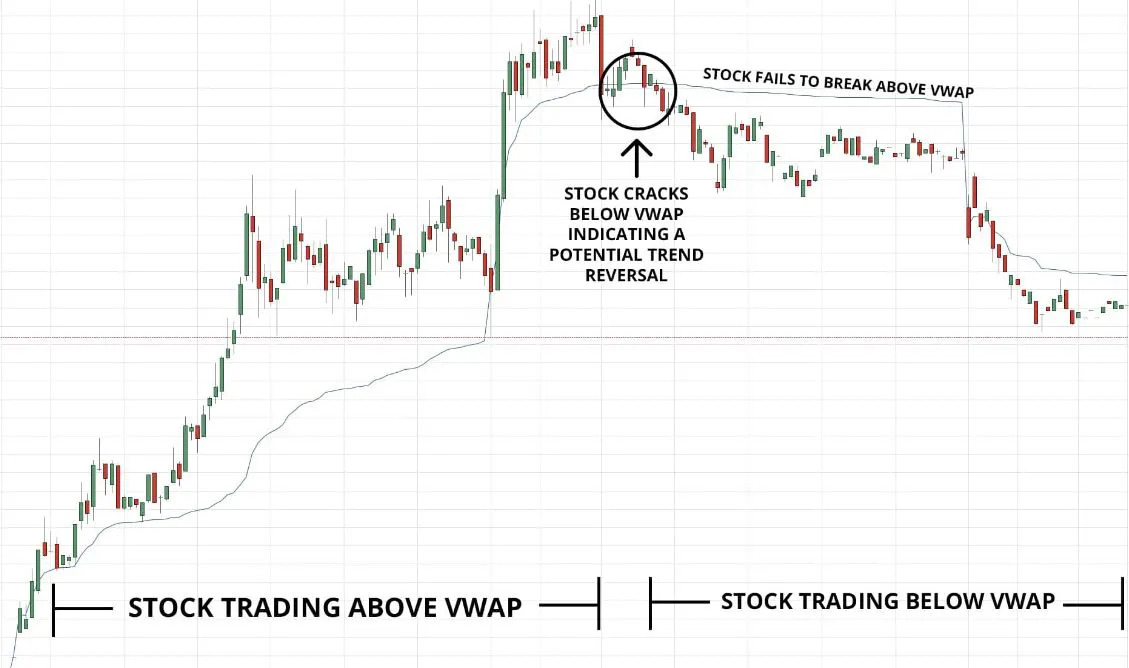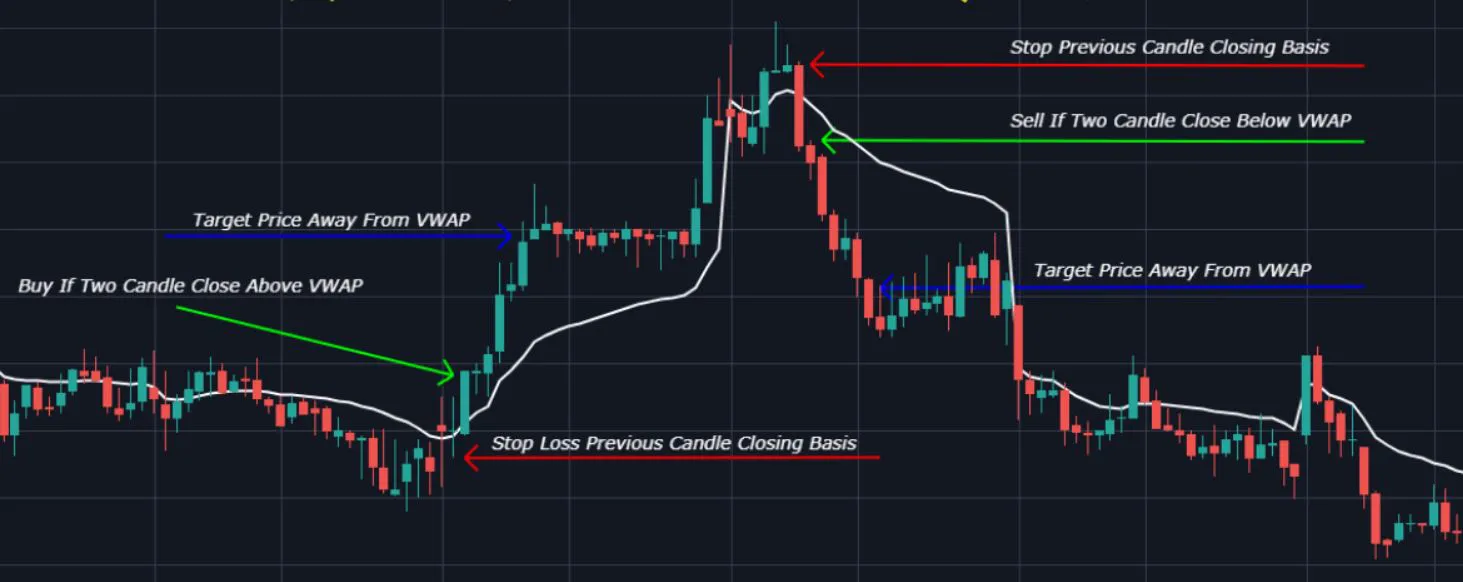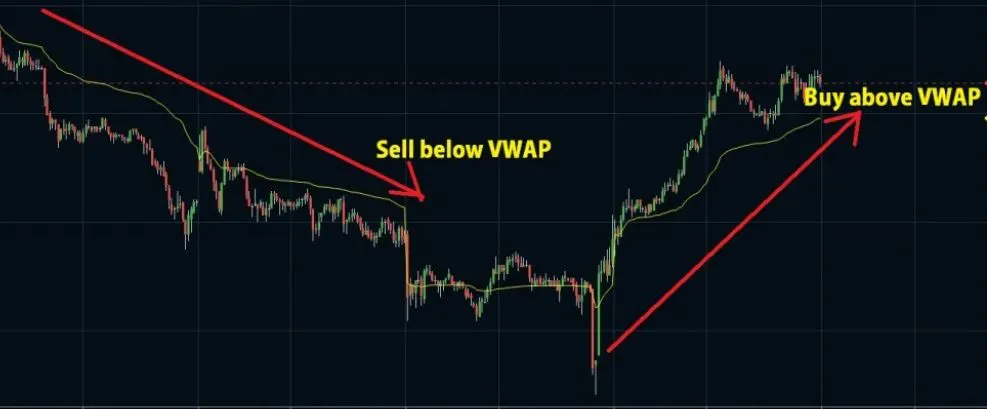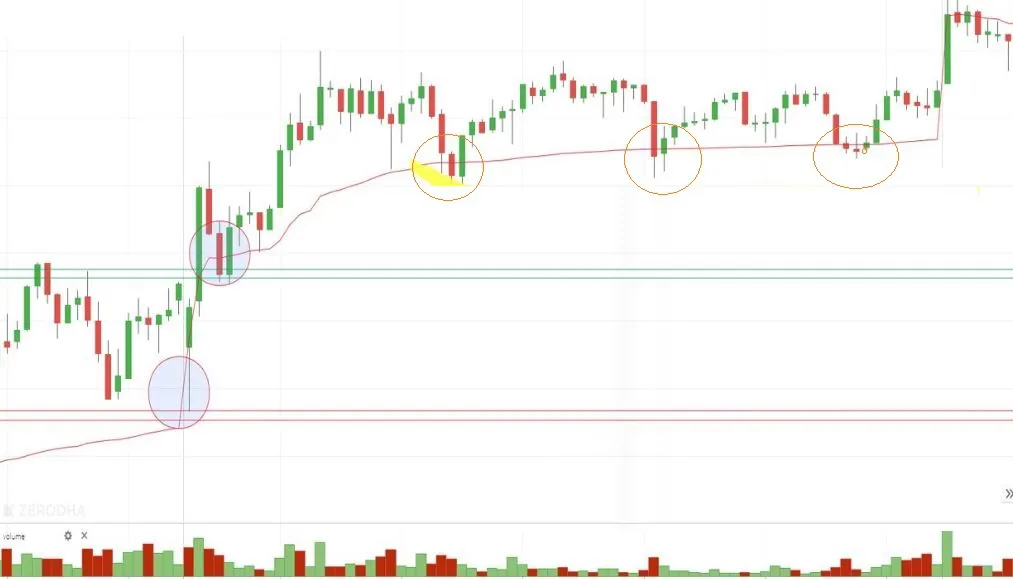
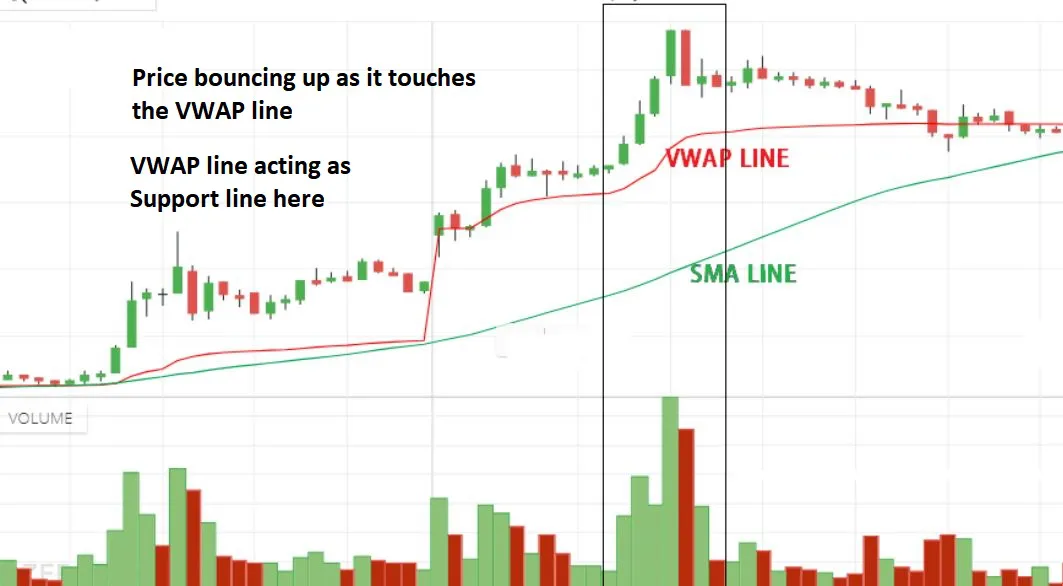
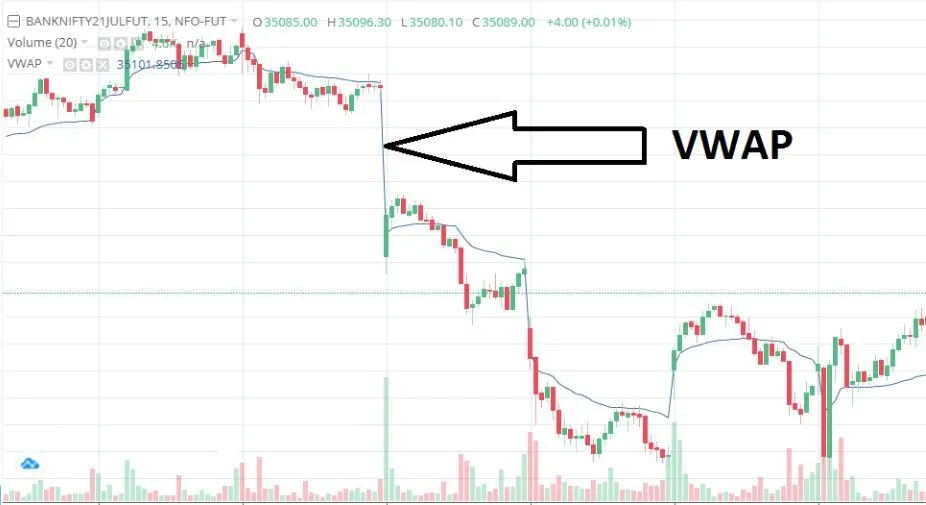
- Identifying Support as price touches or approaches the VWAP line from above and bounces back upwards, it suggests potential support, indicating a buying opportunity.
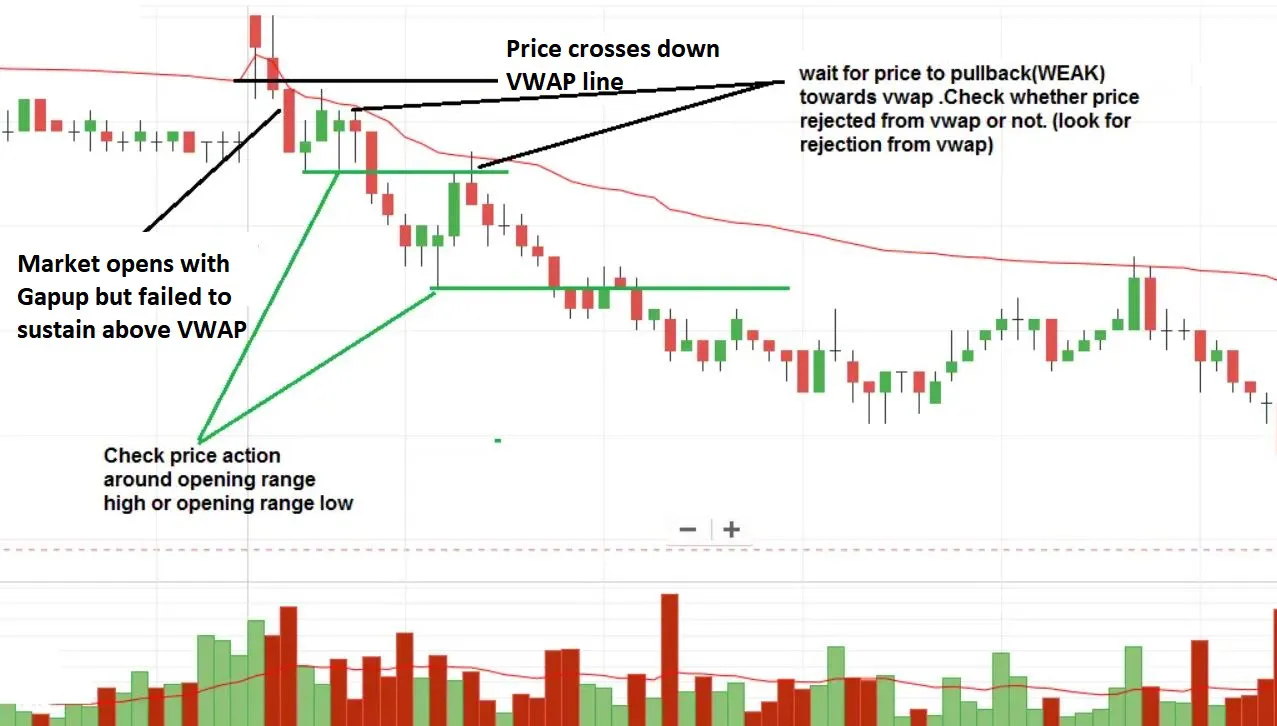
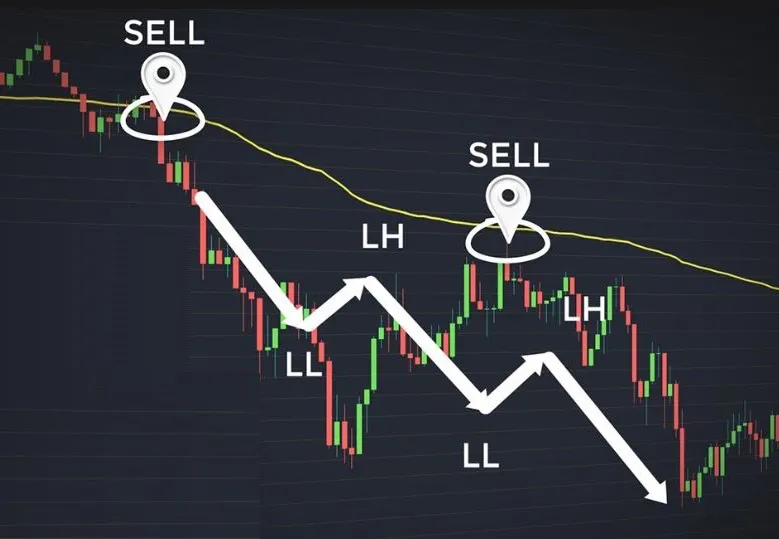
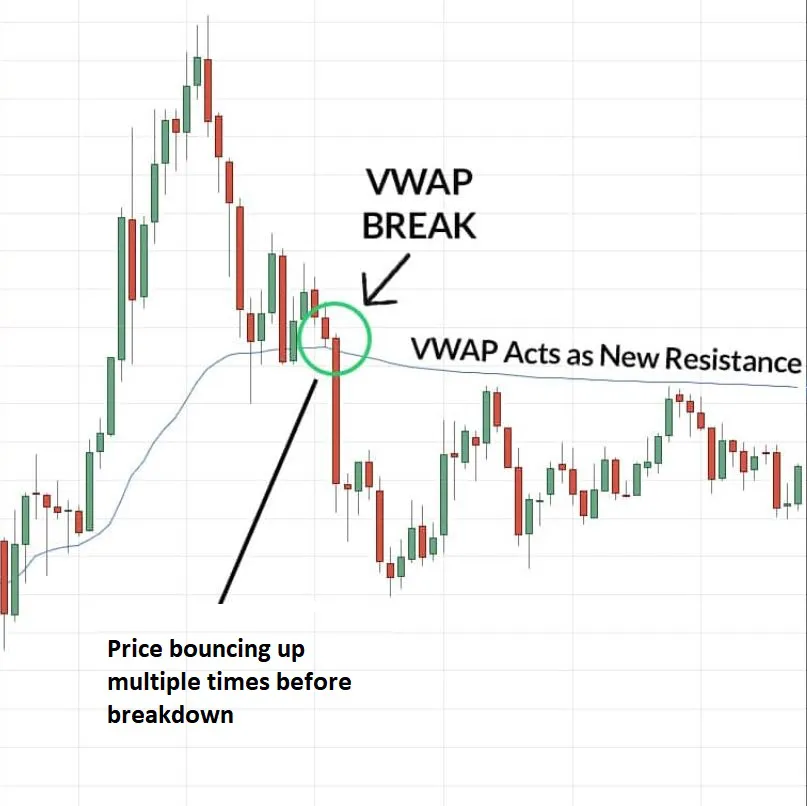
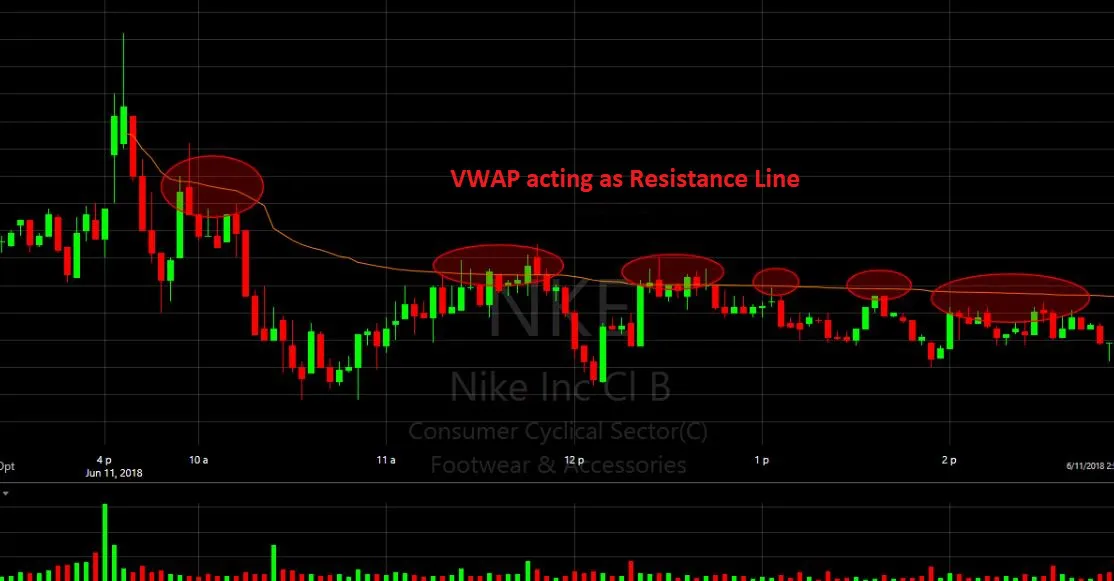
- Identifying Resistance as the price approaches or touches the VWAP line from below and fails to break above it, it indicates potential resistance.
- Confirm above by checking increasing in volume
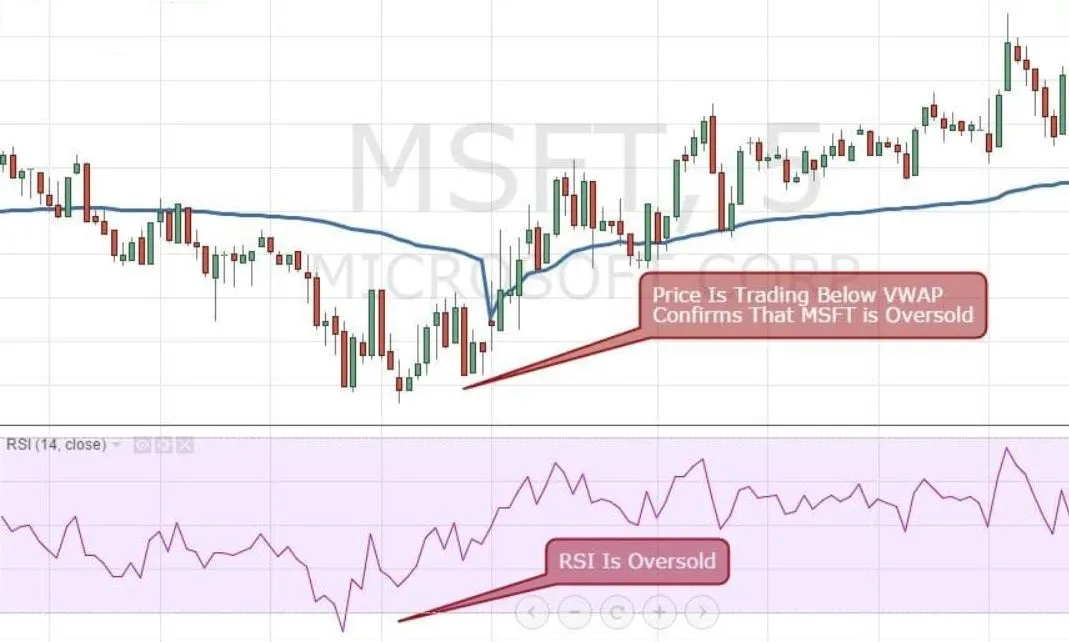
- Try to use other technical indicators such as MACD, MA or Stochastic RSI for proper confirmation
- Works better in short term timeframe.
VWAP
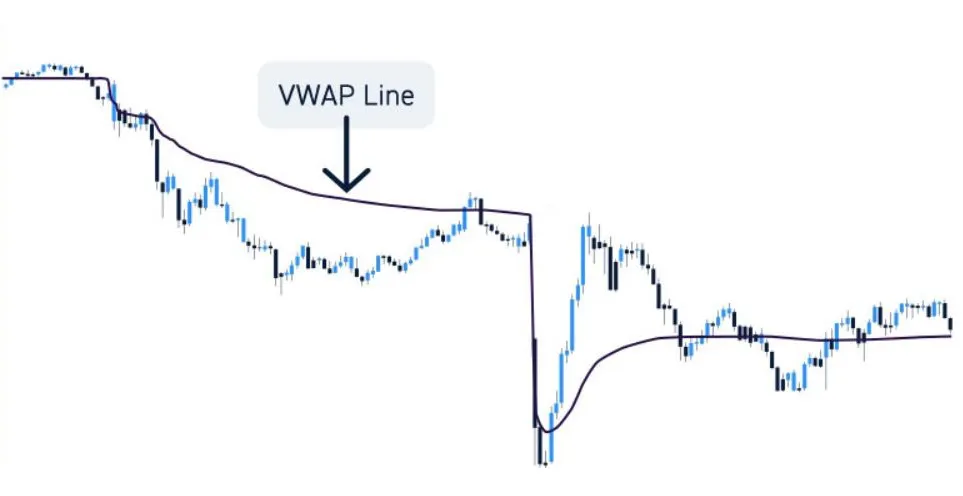
VWAP stands for Volume Weighted Average Price, and it is a popular technical indicator used in trading and technical analysis for identifying the Trend in the market.
Using VWAP, stocks with prices below VWAP can be considered undervalued, while those with prices above VWAP can be considered overvalued.
It calculates the average price of a stock based on both the price and volume traded during a specific period.
VWAP indicator is more popular for short term traders because it gives more importance to current Volume and Price.
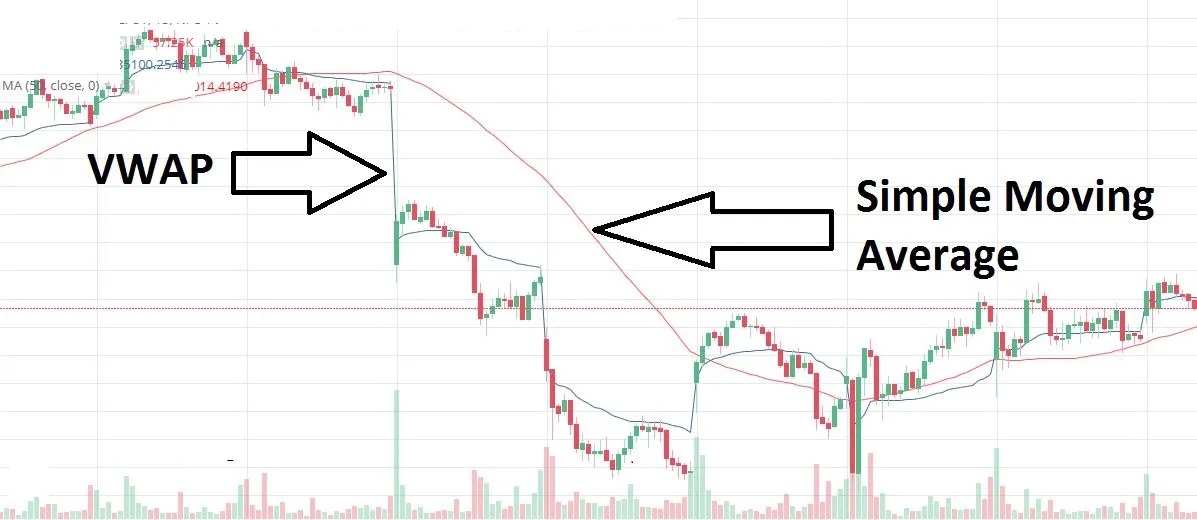
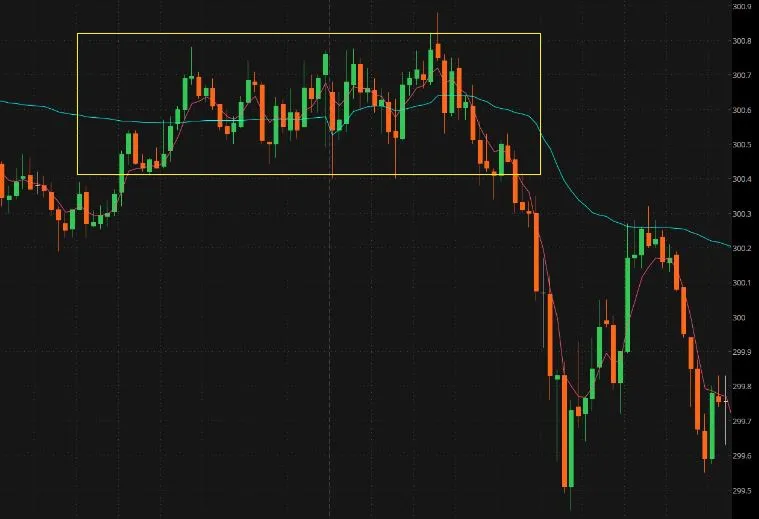
The VWAP indicator is typically displayed as a line on a chart, representing the average price over a specific time period.
It is commonly used by traders and investors to assess the fair value of a security and identify potential support and resistance levels, and market trend.